Fig. 3
Download original image
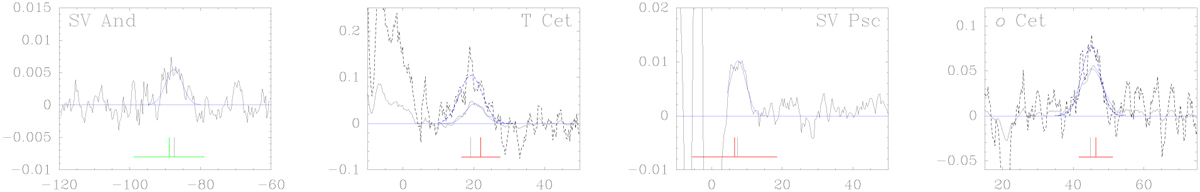
Clear detections (we note that only the first four spectra are shown here; the full set is available in Appendix B). Shown is the flux density of the 21-cm H I line emission, SHI, in Jy, as a function of the radial velocity in the LSR reference frame, VLSR, in km s−1. The peak profiles (see Section 3.2) are indicated by solid black lines, while the total profiles are indicated by dashed black lines. The Gaussians fitted to the profiles are shown as blue lines, solid for fits to the peak profiles and dashed for fits to the total profiles. Spectra are shown for all 34 objects with clear H I detections (see Table B.2). The vertical black lines indicate the centre velocity of our Gaussian fit to the total H I profile (or, if not available, to the peak H I profile), the red vertical and horizontal lines show respectively the central CO or OH line velocity from the literature and its corresponding expansion velocity, whereas green lines indicate other types of literature velocities (e.g. optical or SiO lines) and an indicative expansion velocity of 10 km s−1, that is, the average measured value. The flat blue horizontal lines show the 0 Jy flux density level. The plotted total velocity range of all spectra is 60 km s−1.
Current usage metrics show cumulative count of Article Views (full-text article views including HTML views, PDF and ePub downloads, according to the available data) and Abstracts Views on Vision4Press platform.
Data correspond to usage on the plateform after 2015. The current usage metrics is available 48-96 hours after online publication and is updated daily on week days.
Initial download of the metrics may take a while.