Fig. 2
Download original image
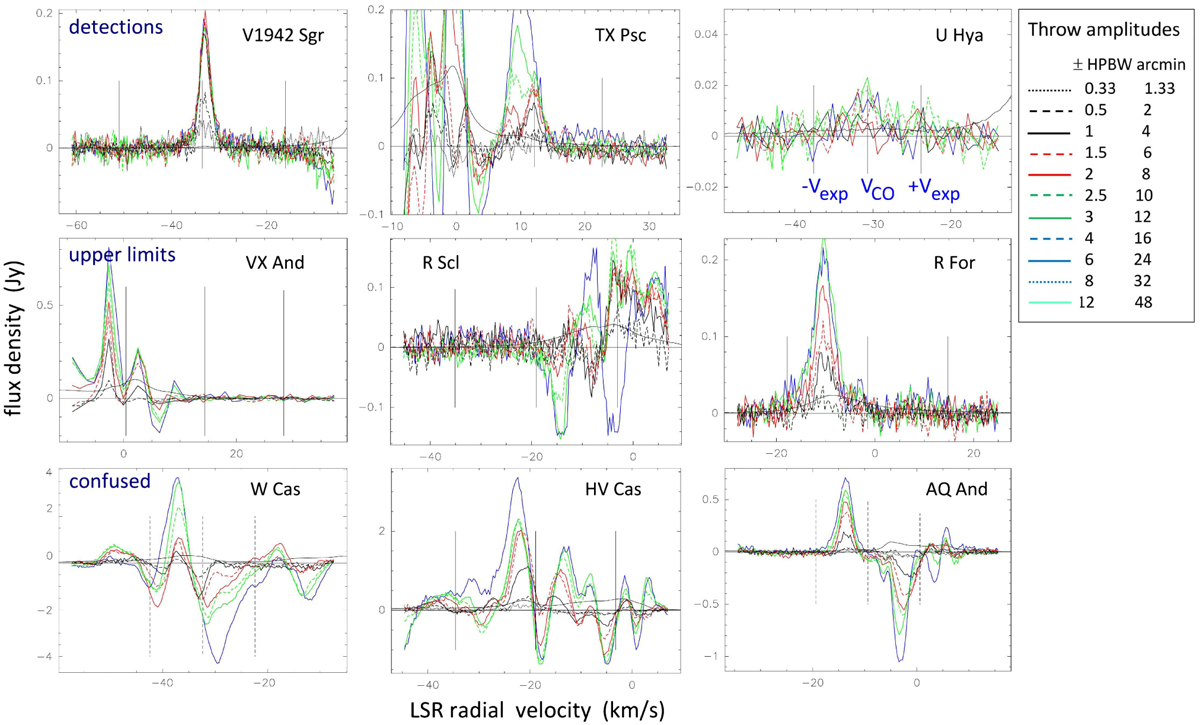
Examples of NRT H I line profiles, showing flux density, SHI, in Jy as a function of radial velocity in the LSR frame, VLSR, in km s−1. The three vertical black lines indicate, respectively, the mean velocity and ± the expansion velocity of the CO line of each source. The sources shown here were classified as either clear H I detections (upper row), upper limits (middle row) or confused (lowest row). The spectra were obtained in position-switching mode for different east-west offset distances between the two off-source positions (throw amplitudes) located symmetrically around the on-source position. For the match between throw amplitudes and types of plotted lines used, we refer to the legend on the right-hand side. Throws are given in both units of the telescope’s east-west beam size (4′) and in arcminutes. The flat black horizontal lines show the 0 Jy flux density level. Also shown (as full black lines, with a shape distinctly different from the position-switching profiles) are the on-source H I profiles obtained in frequency-switching mode, with flux densities divided by a factor of 100. The frequency-switching mode observations were used as a benchmark for the overall confusion level throughout the spectra induced by the telescope’s near side lobes. For detections an increase of the total flux with throw amplitude indicates that the source is extended and the throw amplitude where the flux converges can be used to estimate the source diameter (see Sect. 3).
Current usage metrics show cumulative count of Article Views (full-text article views including HTML views, PDF and ePub downloads, according to the available data) and Abstracts Views on Vision4Press platform.
Data correspond to usage on the plateform after 2015. The current usage metrics is available 48-96 hours after online publication and is updated daily on week days.
Initial download of the metrics may take a while.