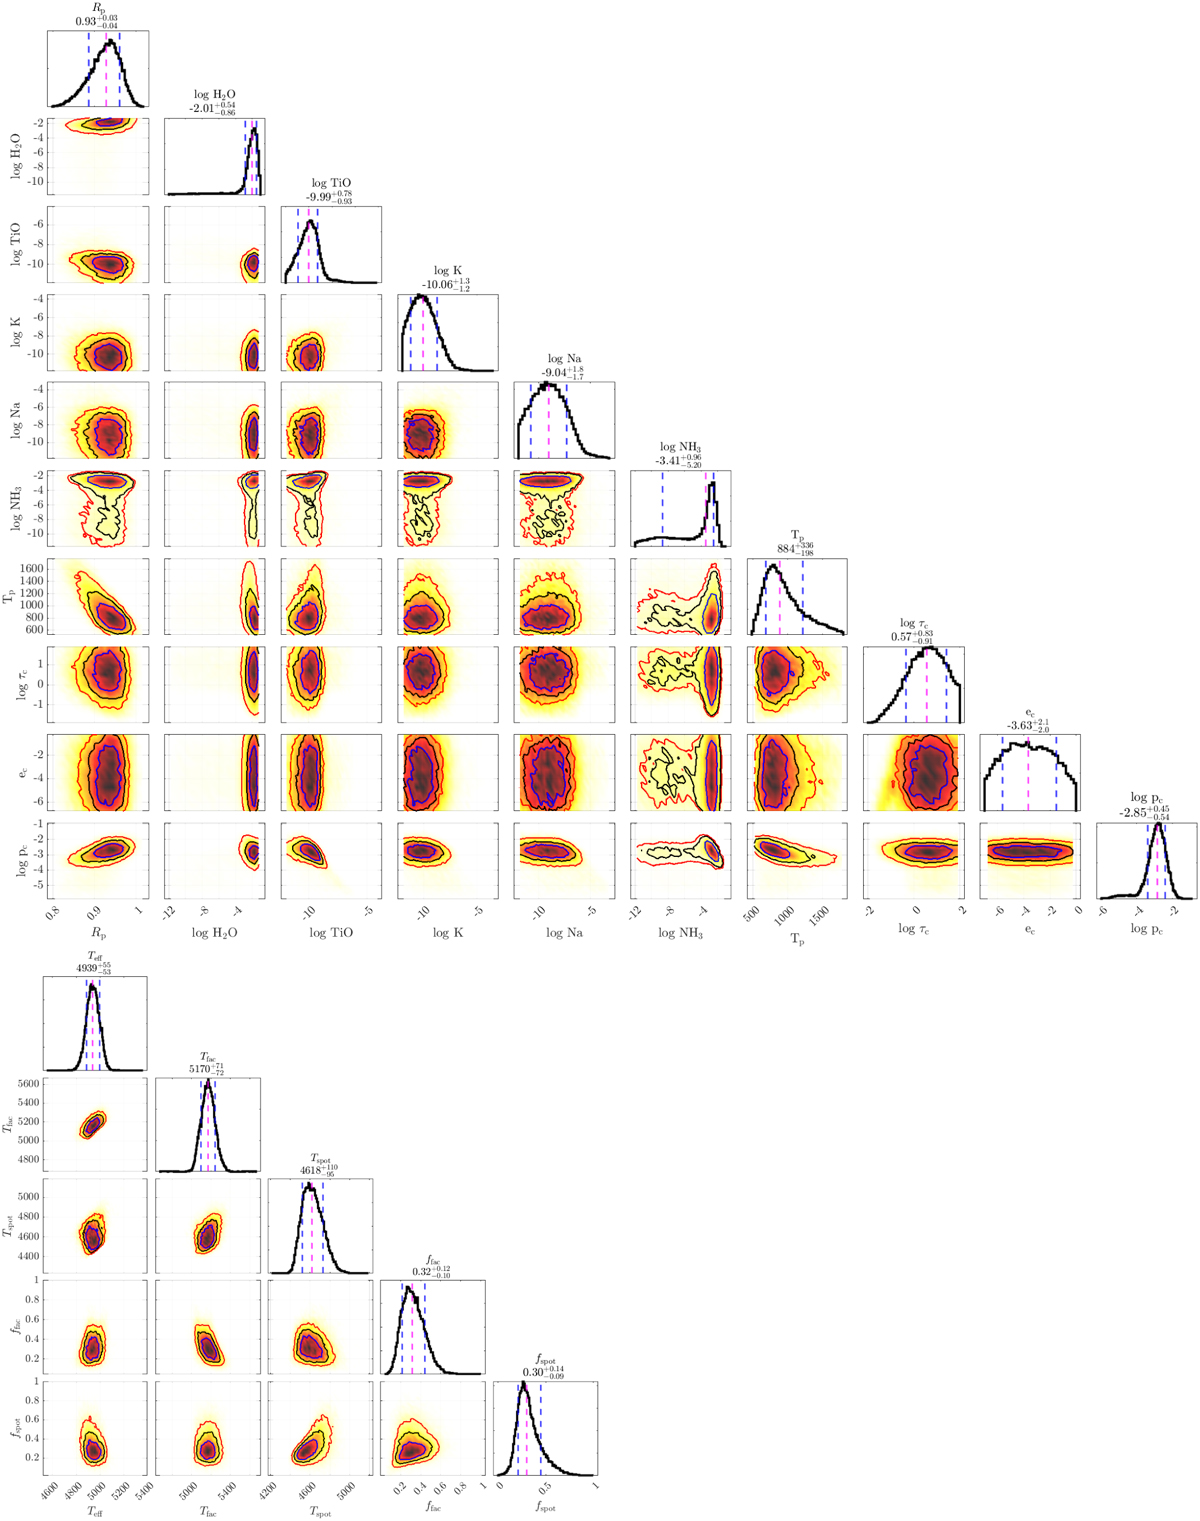
Fig. B.1
Download original image
Posterior distributions for the planet’s atmosphere properties (top) and the stellar parameters (bottom). The vertical, magenta lines in the histogram plots refer to the median value of the depicted distribution, while the blue, vertical lines denote the 1 σ intervals. The three contour lines in the two-dimensional correlation plots refer to the 1 σ, 2σ, and 3σ regions, respectively.
Current usage metrics show cumulative count of Article Views (full-text article views including HTML views, PDF and ePub downloads, according to the available data) and Abstracts Views on Vision4Press platform.
Data correspond to usage on the plateform after 2015. The current usage metrics is available 48-96 hours after online publication and is updated daily on week days.
Initial download of the metrics may take a while.