Open Access
Fig. A.1
Download original image
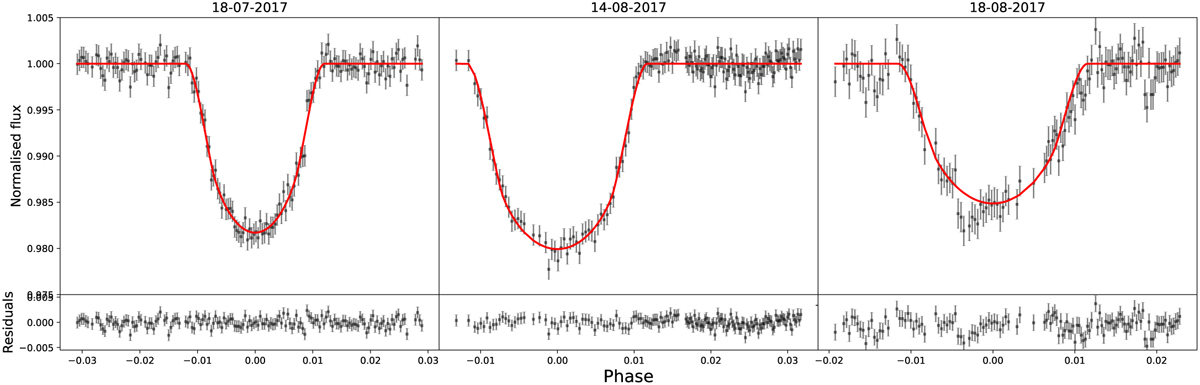
Detrended EulerCam light curves observed simultaneously to the FORS2 data. From left to right, the light curves of the first, second and third night. The top panel show the data after detrending and the transit fit, the bottom panels show the residuals.
Current usage metrics show cumulative count of Article Views (full-text article views including HTML views, PDF and ePub downloads, according to the available data) and Abstracts Views on Vision4Press platform.
Data correspond to usage on the plateform after 2015. The current usage metrics is available 48-96 hours after online publication and is updated daily on week days.
Initial download of the metrics may take a while.