Open Access
Fig. 4
Download original image
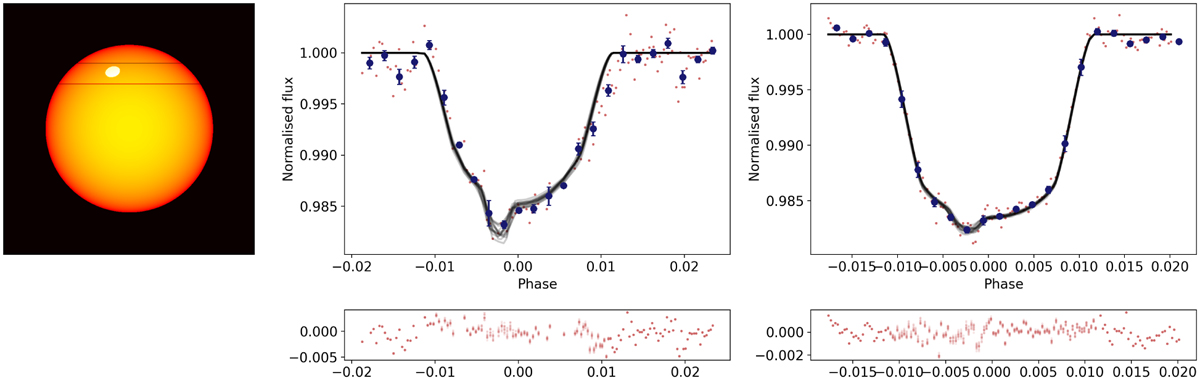
PyTranSpot models for ECAM and FORS2 observations taken on 18 August 2017. Left: toy model of the stellar surface with the occulted facula and transit chord marked. Middle and right: detrended ECAM and FORS2 white light curves with the transit + facula model on top.
Current usage metrics show cumulative count of Article Views (full-text article views including HTML views, PDF and ePub downloads, according to the available data) and Abstracts Views on Vision4Press platform.
Data correspond to usage on the plateform after 2015. The current usage metrics is available 48-96 hours after online publication and is updated daily on week days.
Initial download of the metrics may take a while.