Fig. 3
Download original image
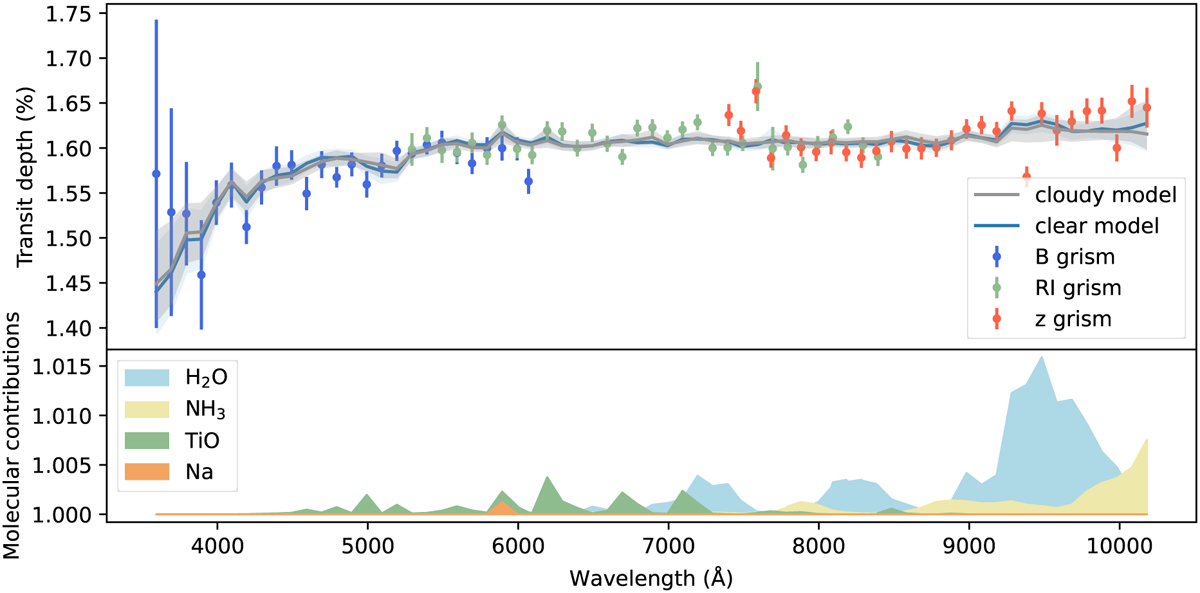
Transmission spectrum of WASP-69b. Top: data points and retrieved models. The blue green and red points are the transit depths obtained from the B, RI, and z grism observations, respectively. The grey line represents the median of all retrieval posterior sample spectra for the favoured power-law cloud model, with the shaded region indicating their 1σ interval. The blue line represents the cloud free model. Bottom: relative contributions of the different atoms and molecules to the retrieved spectrum.
Current usage metrics show cumulative count of Article Views (full-text article views including HTML views, PDF and ePub downloads, according to the available data) and Abstracts Views on Vision4Press platform.
Data correspond to usage on the plateform after 2015. The current usage metrics is available 48-96 hours after online publication and is updated daily on week days.
Initial download of the metrics may take a while.