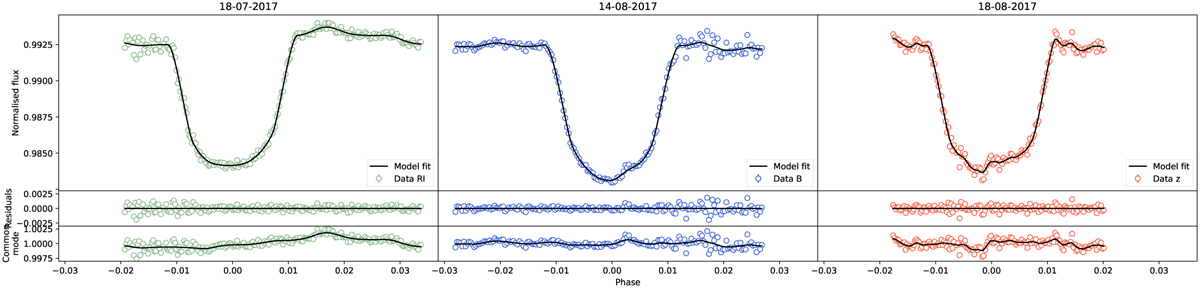
Fig. 2
Download original image
FORS2 white light curves with noise models and residuals. The top row shows the white light curves and fits for all three nights: the first night observations were done in the RI grism (green, left), the second in the B grism (blue, middle), and the third in the z grism (red, right). Data points are indicated with open circles, while the solid lines indicate the fitted transit and GP model. The second row shows the residuals for each of the light curves and the third row shows the obtained common mode noise model in colour with the GP fit overplotted in black. The GP fits and common noise models for the B and z grisms clearly show the crossing of the respective active regions.
Current usage metrics show cumulative count of Article Views (full-text article views including HTML views, PDF and ePub downloads, according to the available data) and Abstracts Views on Vision4Press platform.
Data correspond to usage on the plateform after 2015. The current usage metrics is available 48-96 hours after online publication and is updated daily on week days.
Initial download of the metrics may take a while.