Fig. 2.
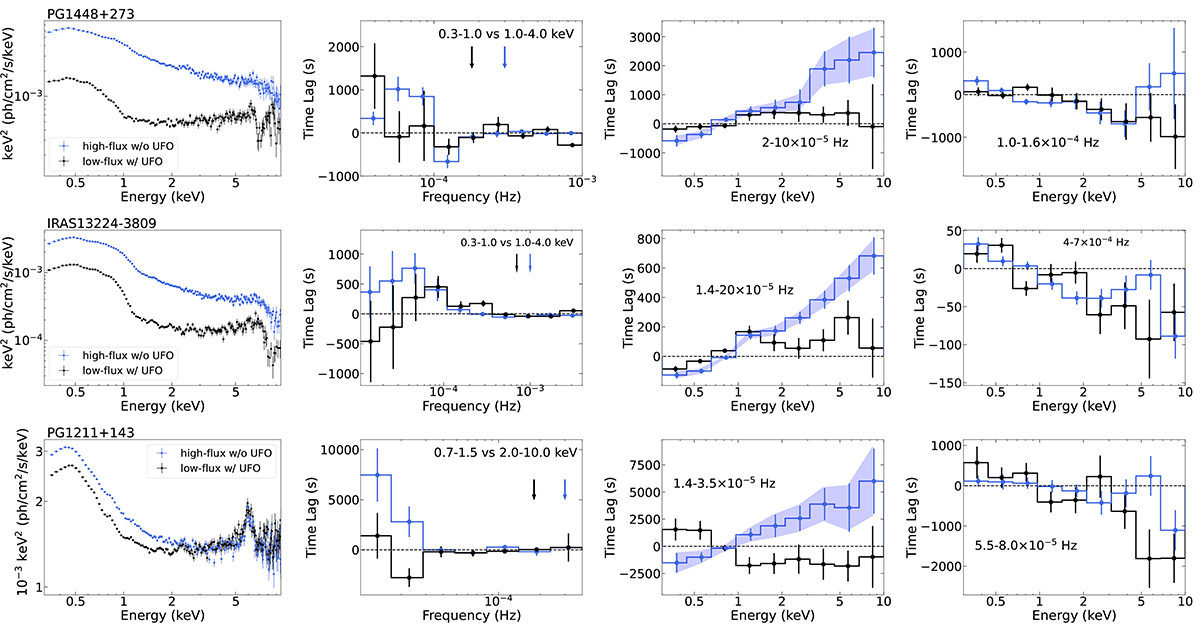
Download original image
X-ray time lags for PG 1448 (top), IRAS 13224 (middle), and PG 1211 (bottom). The “low-/high-flux w/wo UFO” observations are marked in black and royal blue, respectively. The first column shows the unfolded stacked flux energy spectrum with respect to a power law of Γ = 2 of each AGN. The second column shows the lag-frequency spectrum between soft and hard energy bands. The arrows separately refer to the frequencies, at which the PSD of the highest-energy bin (in the lag-energy spectra) becomes dominated by Poisson noise, for the corresponding stacked observations. The third and fourth columns present the low- (third) and high-frequency (fourth) lag-energy spectra separately at particular frequencies, marked in the plots. The shaded blue regions in the low-frequency lag-energy spectra show the 1σ spread in lags from MC simulations (see details in Sect. 3.2).
Current usage metrics show cumulative count of Article Views (full-text article views including HTML views, PDF and ePub downloads, according to the available data) and Abstracts Views on Vision4Press platform.
Data correspond to usage on the plateform after 2015. The current usage metrics is available 48-96 hours after online publication and is updated daily on week days.
Initial download of the metrics may take a while.