Fig. 1.
Download original image
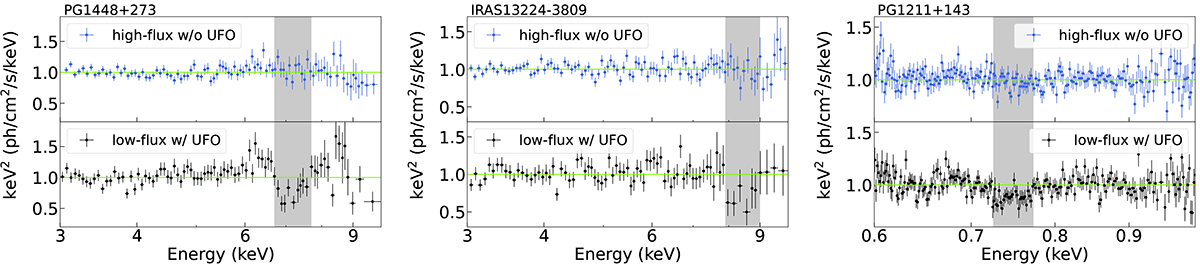
Data-to-model ratios of stacked EPIC (PG 1448 and IRAS 13224) and RGS (PG 1211) spectra to the best-fit broadband continuum model (see details in Sect. 3). The “high-flux w/o UFO” and “low-flux w/ UFO” results are marked by royal blue and black points, respectively. The energy band distinctly affected by the UFO is marked by the gray region.
Current usage metrics show cumulative count of Article Views (full-text article views including HTML views, PDF and ePub downloads, according to the available data) and Abstracts Views on Vision4Press platform.
Data correspond to usage on the plateform after 2015. The current usage metrics is available 48-96 hours after online publication and is updated daily on week days.
Initial download of the metrics may take a while.