Fig. 6
Download original image
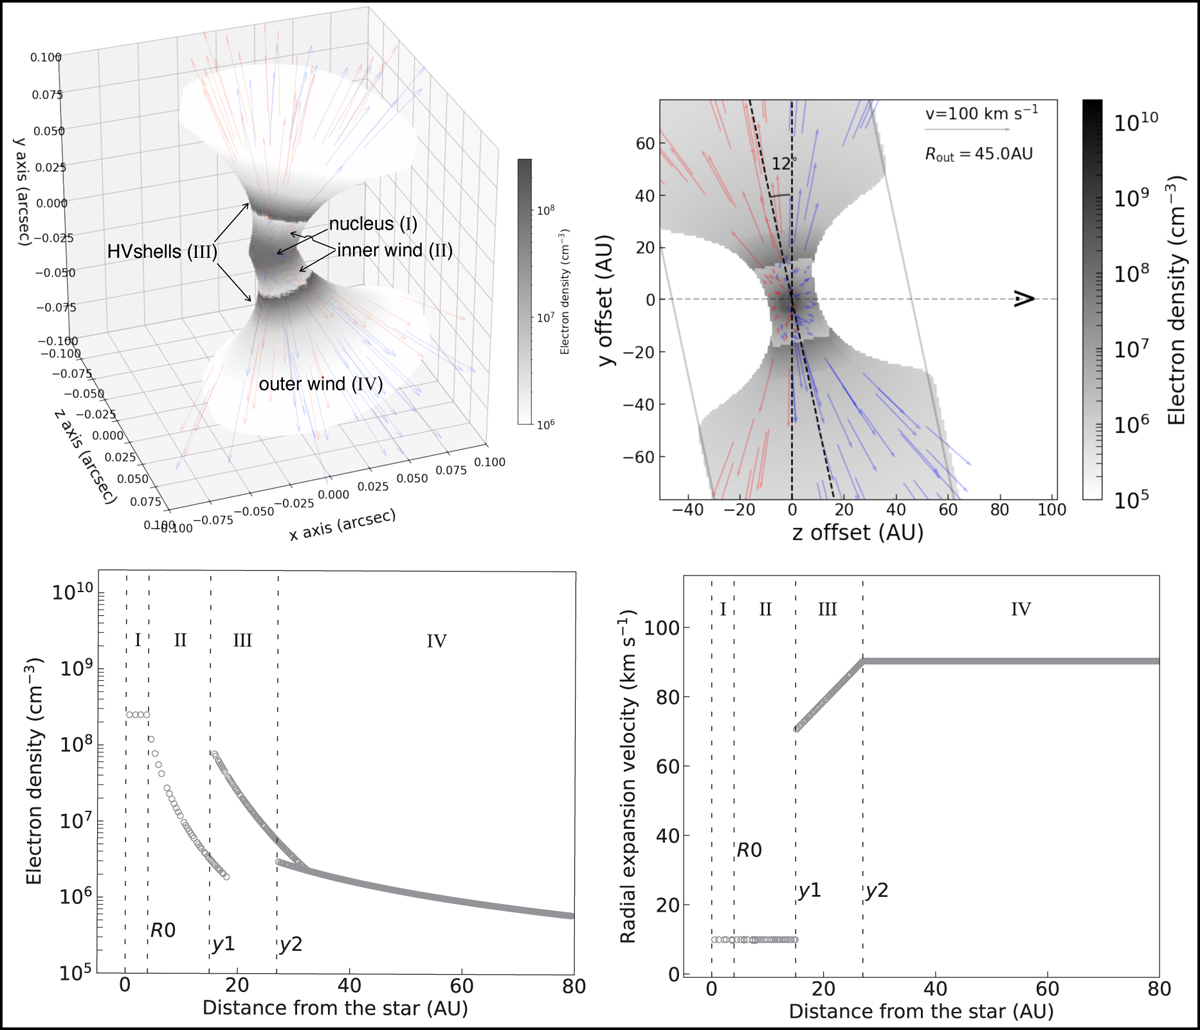
Schematic view of the geometry and main parameters of our model of the ionized core of M 2-9 (Sect. 6.1 and Table 3). Top-left: 3D view indicating the four major structural components in our model, namely: nucleus (I), inner wind (II), high-velocity spots/shells (HVS, III), outer wind (IV). Colour scale represents density as indicated in the right wedge; arrows represent the velocity field (colour indicate blue or red Doppler shift with respect to the line of sight). The line of sight runs along the z-axis. Top-right: 2D view through the x=0 offset. Bottom panels show the radial distribution of the electron density (left) and radial expansion velocity modulus (right) adopted in our model. Vertical dashed lines indicate the boundaries of regions I-IV.
Current usage metrics show cumulative count of Article Views (full-text article views including HTML views, PDF and ePub downloads, according to the available data) and Abstracts Views on Vision4Press platform.
Data correspond to usage on the plateform after 2015. The current usage metrics is available 48-96 hours after online publication and is updated daily on week days.
Initial download of the metrics may take a while.