Fig. 5
Download original image
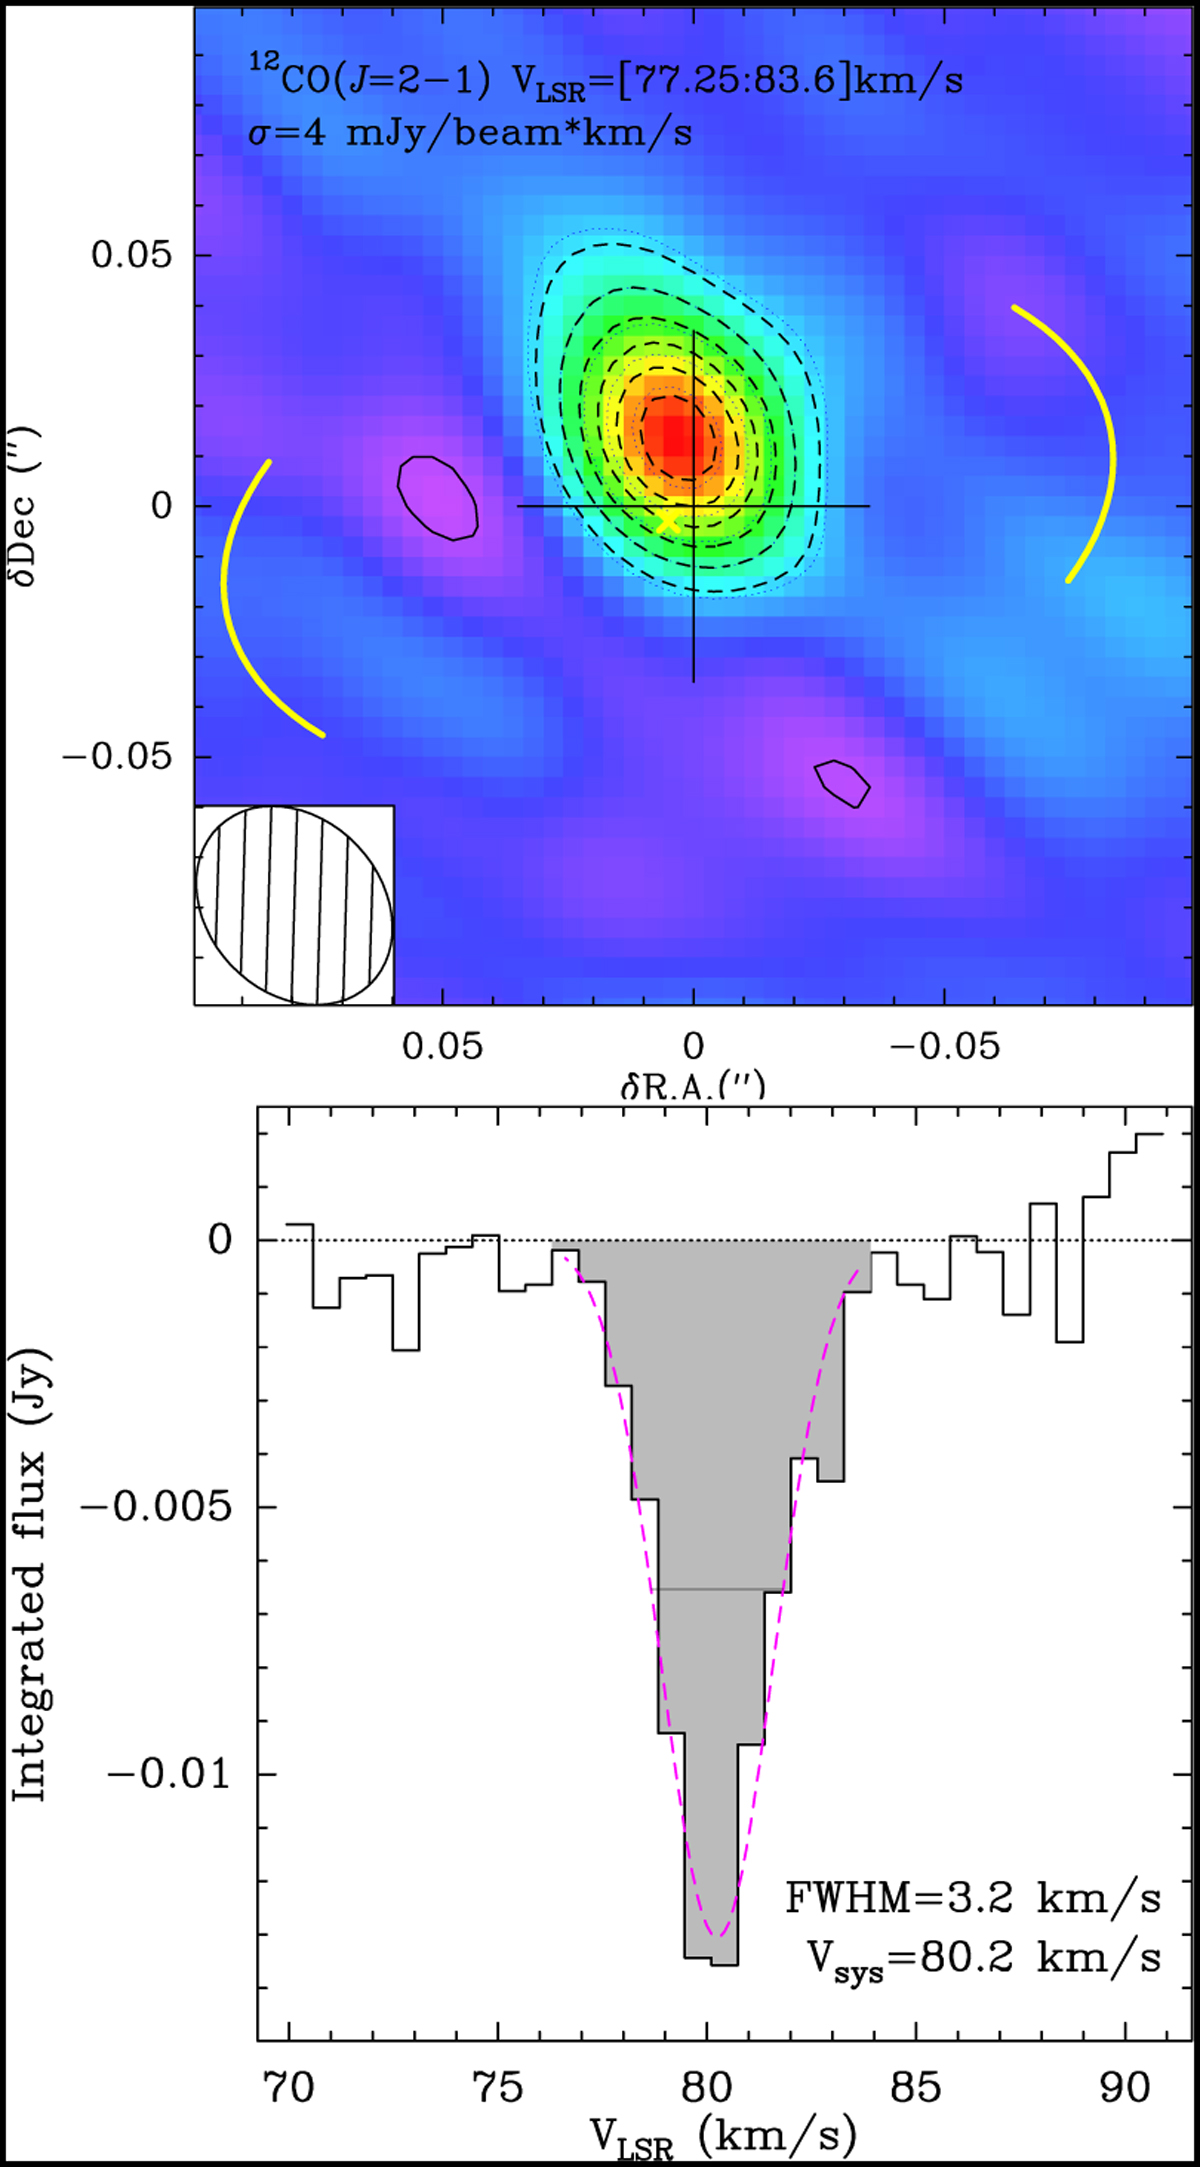
Compact 12CO (J=2−1) absorption feature observed toward the central regions of M 2-9. Top: integrated intensity map of the CO absorption in the velocity range VLSR=[77.25:83.6] km s−1. Dashed and solid lines are used for negative and positive contours, respectively. Level spacing is 2σ to −13σ by −2σ (σ=4 mJy/beam). The yellow arcs represent the outer boundary of the broad-waist structure, plausibly a compact dust disk, observed in the 1 mm continuum maps. Bottom: line profile integrated over the area where CO absorption is observed.
Current usage metrics show cumulative count of Article Views (full-text article views including HTML views, PDF and ePub downloads, according to the available data) and Abstracts Views on Vision4Press platform.
Data correspond to usage on the plateform after 2015. The current usage metrics is available 48-96 hours after online publication and is updated daily on week days.
Initial download of the metrics may take a while.