Fig. 3
Download original image
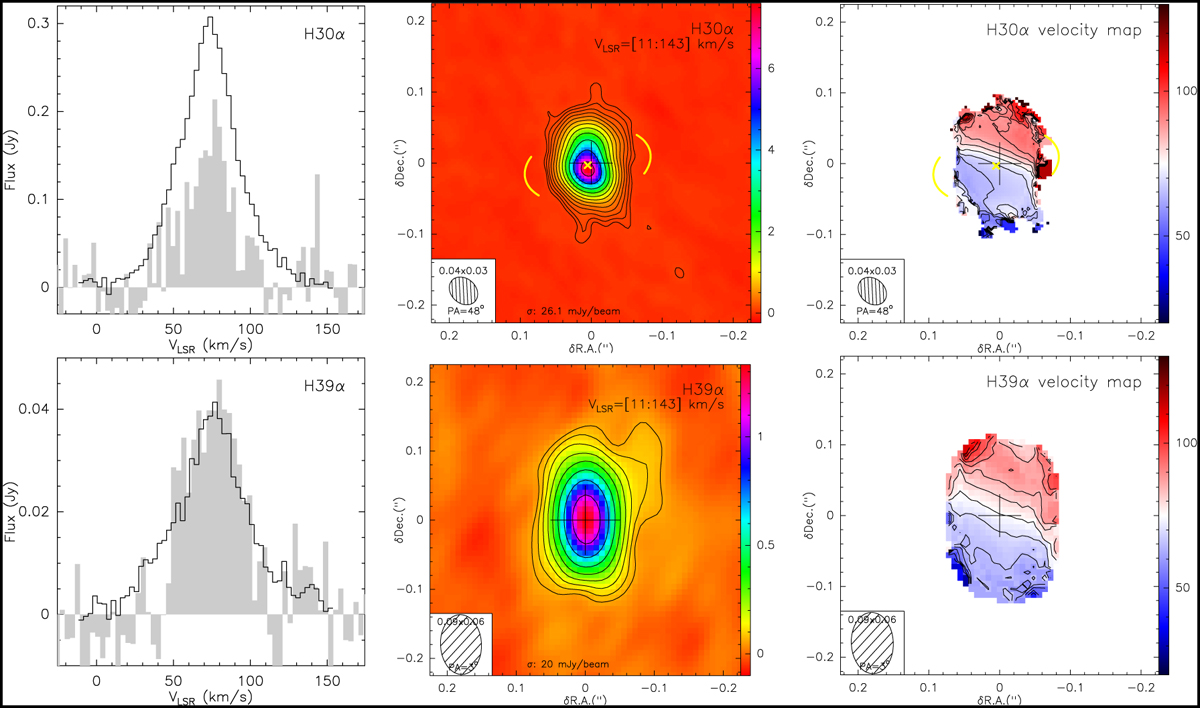
Summary of ALMA data of the H30α (top) and H39α (bottom) lines (see also Figs. A.2 and A.3). Left: integrated line spectrum obtained with ALMA (black lines) and with the IRAM-30 m antenna (gray histogram, CSC17). Middle: line emission maps integrated over the line profile (LSR velocity range [11:143] km s−1). The level contours are (3σ)×1.5(i−1) Jy beam−1, i =1,2,3… Right: first moment map. Contours going from VLSR=45 to 115 km s−1 by 5 km s−1. The color bars indicate the VLSR-colour relationship.
Current usage metrics show cumulative count of Article Views (full-text article views including HTML views, PDF and ePub downloads, according to the available data) and Abstracts Views on Vision4Press platform.
Data correspond to usage on the plateform after 2015. The current usage metrics is available 48-96 hours after online publication and is updated daily on week days.
Initial download of the metrics may take a while.