Fig. 2
Download original image
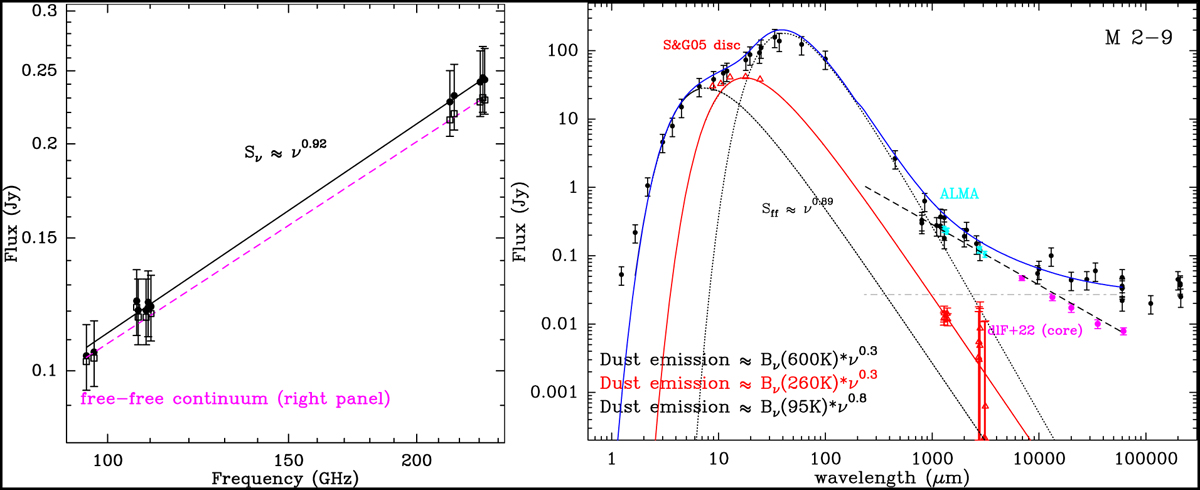
Spectral energy distribution of M 2-9. Left: total (dust and free-free) mm continuum fluxes measured with ALMA in different SPWs (filled circles, Table 1). The global fit (Sν ∝ v0·92±0·1) is depicted with a solid line. The dashed line represents a fit to the free-free emission in the radio continuum, using the 4.9–43 GHz datasets from de la Fuente et al. (2022), which also reproduces our mm continuum fluxes after subtracting the contribution from a compact ~260 K dust component (shown in the right panel) – open squares. Right: SED of M 2-9 from the near-IR to the radio domain as in Sánchez Contreras et al. (2017) and including our ALMA mm continuum flux measurements (cyan). Radio continuum flux measurements at 4.9–43 GHz from the ionized wind/core as reported by de la Fuente et al. (2022) are indicated with pink circles. Mid-IR photometry of the compact, warm (~260 K) dust disk at the core of M 2-9 is shown with red triangles in the 8-20 µm range. Fits to the free- free and dust thermal emission are depicted, with the nearly flat continuum from the ionized bipolar lobes and the free-free emission from the ionized wind/core (Sv ∝ ν0·89) shown as a dotted-dashed and a dashed line, respectively. Several modified black-body components are also plotted, including a ~95 K component originating from dust located in the extended bipolar lobes, and filtered in our ALMA maps, (dotted line) and a ~260 K component arising from dust in a compact disk at the center of M 2-9 (red line). For completeness, a hot ~600 K dust component, which is necessary to explain the optical/NIR photometry, is also represented. The blue solid line represents the combined fits for the free-free and dust emission components. The red triangles at 1 mm and 3 mm represent the residual dust emission of M 2-9 after subtracting a Sv ∝ ν0.89 free-free emission component from the ionized wind/core.
Current usage metrics show cumulative count of Article Views (full-text article views including HTML views, PDF and ePub downloads, according to the available data) and Abstracts Views on Vision4Press platform.
Data correspond to usage on the plateform after 2015. The current usage metrics is available 48-96 hours after online publication and is updated daily on week days.
Initial download of the metrics may take a while.