Fig. C.1
Download original image
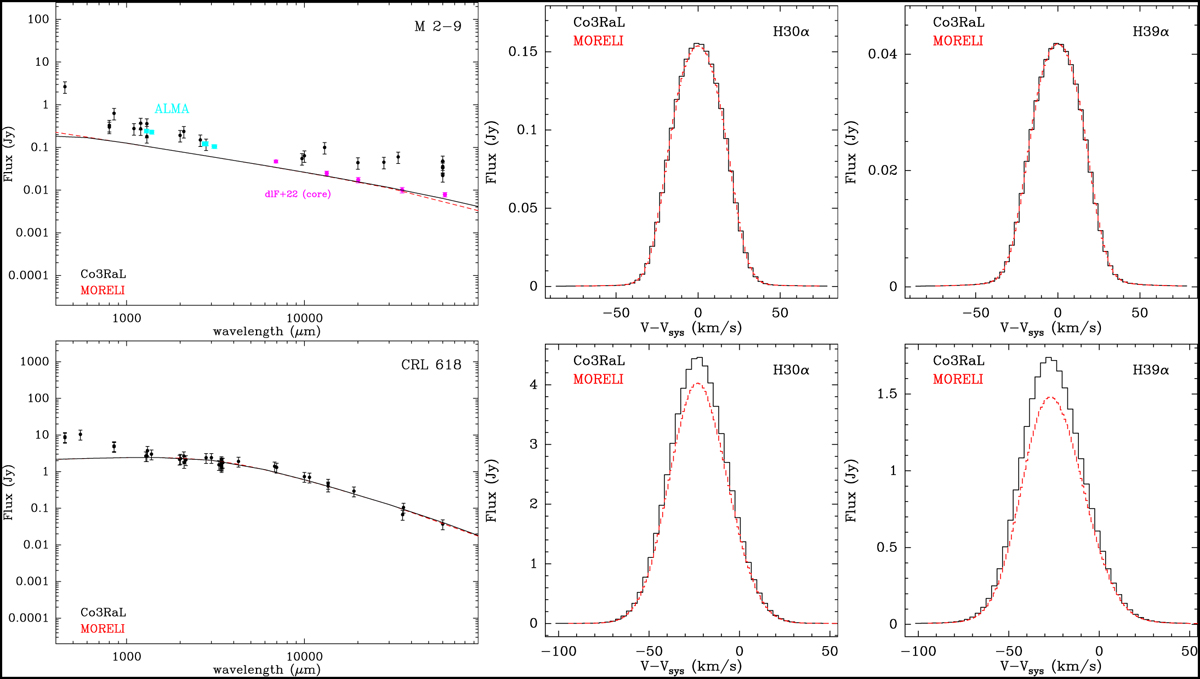
Comparison between the predictions by Co3RaL and MORELI for the input model of M 2-9 (LTE, top) and CRL 618 (NLTE, bottom) presented in CSC17 that were designed to reproduce the IRAM-30 m single-dish data reported by these authors – see Sect. C. Left) Synthetic free-free continuum emission spectrum predicted by Co3RaL (black solid line) and MORELI (red dashed line). Data points (circles), shown as a reference, are as in Fig. 1 for M2-9 and as in CSC17 for CRL 618. Middle and Right) Synthetic H30α and H39α 1d spectra (integrated over the emitting region) predicted by Co3RaL (solid black histogram) and MORELI (dashed red histogram).
Current usage metrics show cumulative count of Article Views (full-text article views including HTML views, PDF and ePub downloads, according to the available data) and Abstracts Views on Vision4Press platform.
Data correspond to usage on the plateform after 2015. The current usage metrics is available 48-96 hours after online publication and is updated daily on week days.
Initial download of the metrics may take a while.