Fig. B.4
Download original image
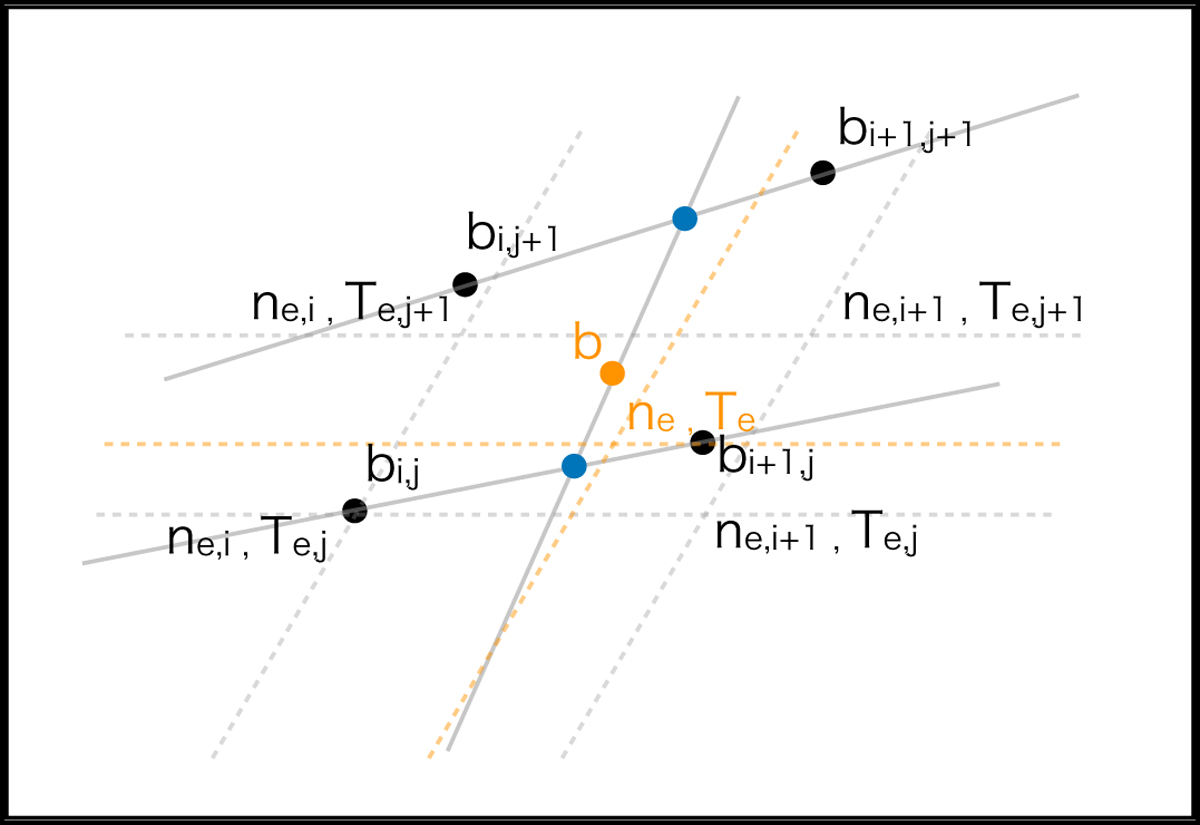
Diagram depicting the procedure to find the value of the NLTE departure coefficient for any arbitrary electron density and temperature. The gray dashed lines indicate the coordinates of the discrete values of density and temperature from the Storey & Hummer (1995) tables (shown as black dots). The orange dashed lines indicate the coordinates of an arbitrary value of electron density and temperature. The solid gray lines indicate interpolation between discrete coefficient values of different densities but the same temperature. The blue dots represent the points connecting the two linear interpolations at an arbitrary electron density. Finally, the orange dot corresponds to the value that Co3RaL uses for an arbitrary electron density and temperature.
Current usage metrics show cumulative count of Article Views (full-text article views including HTML views, PDF and ePub downloads, according to the available data) and Abstracts Views on Vision4Press platform.
Data correspond to usage on the plateform after 2015. The current usage metrics is available 48-96 hours after online publication and is updated daily on week days.
Initial download of the metrics may take a while.