Fig. 1
Download original image
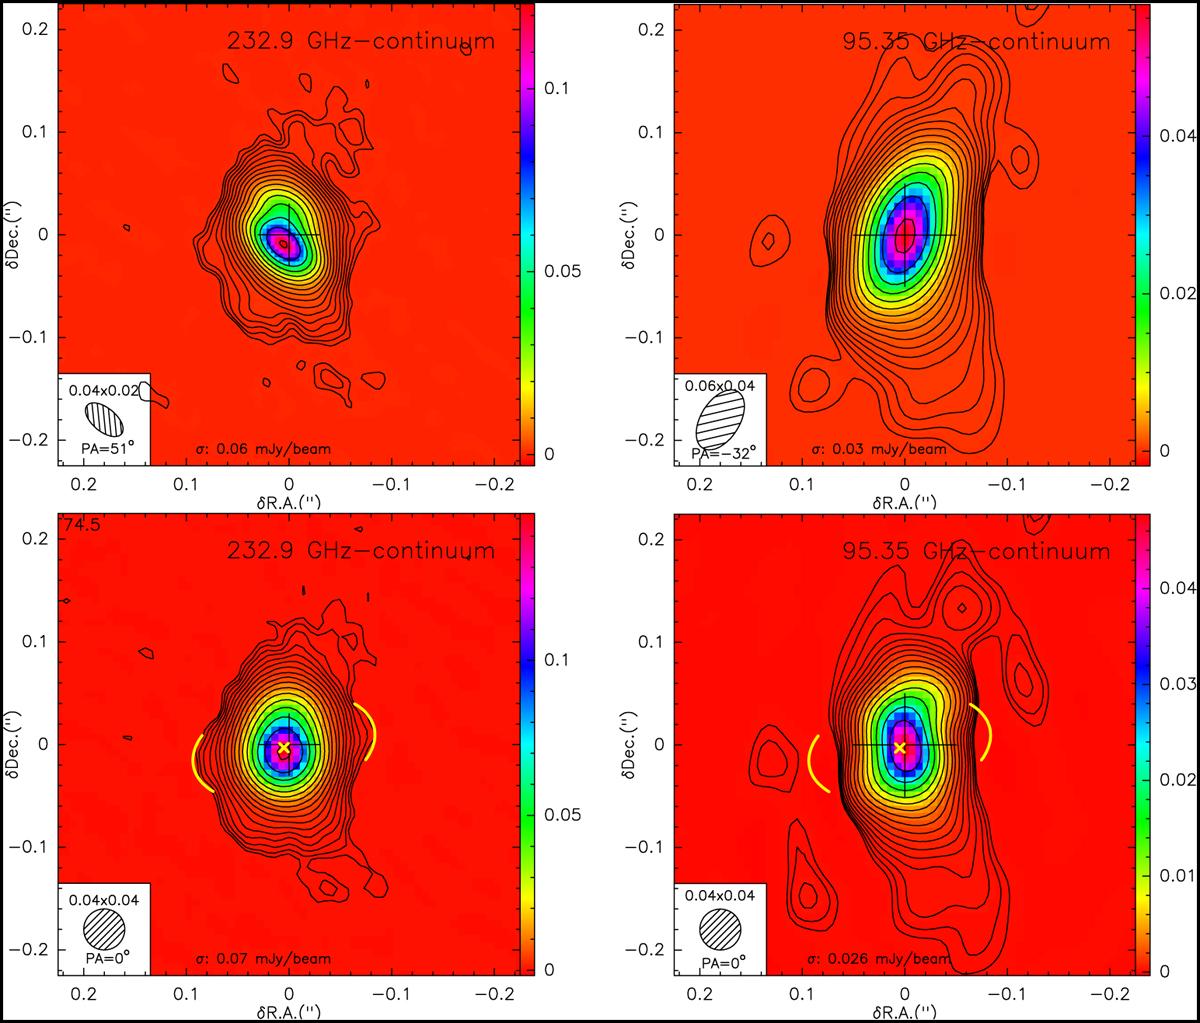
ALMA continuum emission maps of M 2-9 at 232.9 GHz (left) and 95.4 GHz (right). The top row displays the images after image restoration using the nominal beam size at each frequency (Sect. 3). The bottom row presents the images with a circular restoring beam of 0.″04 at both frequencies, allowing for an optimal comparison between the two. The level contours are (3σ)×1.5(i−1) Jy beam−1, i =1,2,3… The central cross marks the 3 mm continuum surface brightness peak at coordinates J2000 RA=17h05m37s.9668 and Dec=−10º08′32.″65 (J2000). The yellow arcs, centered at the small yellow cross, represent the broad-waist structure, plausibly a dust disk, detected at 1 mm but not at 3 mm.
Current usage metrics show cumulative count of Article Views (full-text article views including HTML views, PDF and ePub downloads, according to the available data) and Abstracts Views on Vision4Press platform.
Data correspond to usage on the plateform after 2015. The current usage metrics is available 48-96 hours after online publication and is updated daily on week days.
Initial download of the metrics may take a while.