Fig. 4.
Download original image
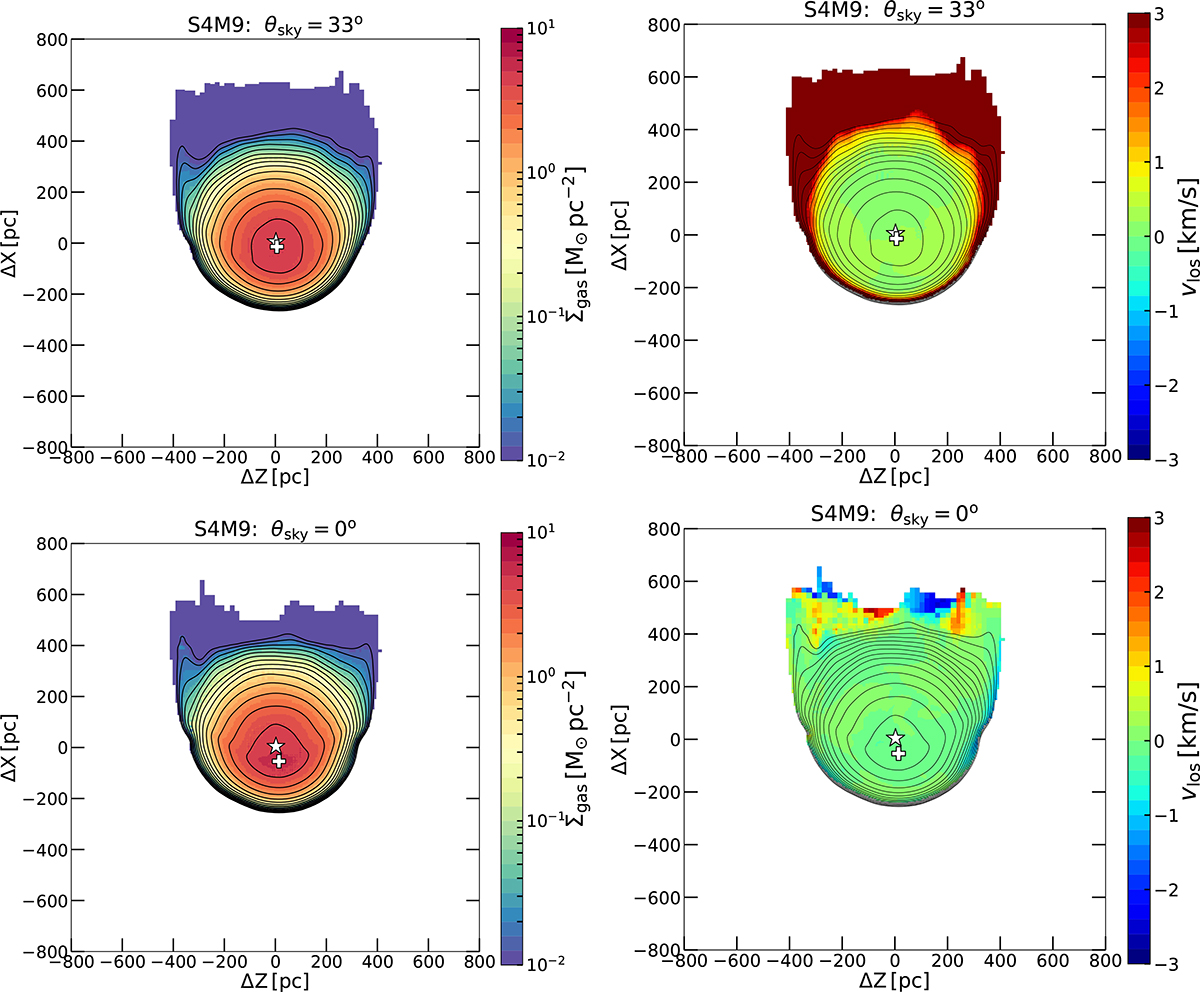
Scenario I: Snapshot of the model M5 (S4M9) surface mass (left) and LOS velocity (right) projected with θsky = 18° corresponding to the BA–FI+P orbital solution with a final tangential velocity of ![]() (top rows). This model uses the low-mass dwarf model D1. The combined centre of mass for the stellar and dark matter distributions is marked with the white star, and the gas peak is marked with the white cross. Here the satellite is found passing over the perturbation added to the IGM with
(top rows). This model uses the low-mass dwarf model D1. The combined centre of mass for the stellar and dark matter distributions is marked with the white star, and the gas peak is marked with the white cross. Here the satellite is found passing over the perturbation added to the IGM with ![]() . We also project the model with 0° (bottom row) to better reveal the transient offset between the gas and stars; however, this causes the transient LOS velocity gradient to vanish due the projection. The vlos maps are in the rest frame of the dwarf’s dark matter centre of mass. The contours on the leading side may cover the velocity map due to the strong compression, which can be avoided by zooming in the pdf version. We note that
. We also project the model with 0° (bottom row) to better reveal the transient offset between the gas and stars; however, this causes the transient LOS velocity gradient to vanish due the projection. The vlos maps are in the rest frame of the dwarf’s dark matter centre of mass. The contours on the leading side may cover the velocity map due to the strong compression, which can be avoided by zooming in the pdf version. We note that ![]() corresponds here to NHI = 1.2 × 1020 cm−2.
corresponds here to NHI = 1.2 × 1020 cm−2.
Current usage metrics show cumulative count of Article Views (full-text article views including HTML views, PDF and ePub downloads, according to the available data) and Abstracts Views on Vision4Press platform.
Data correspond to usage on the plateform after 2015. The current usage metrics is available 48-96 hours after online publication and is updated daily on week days.
Initial download of the metrics may take a while.