Fig. 9.
Download original image
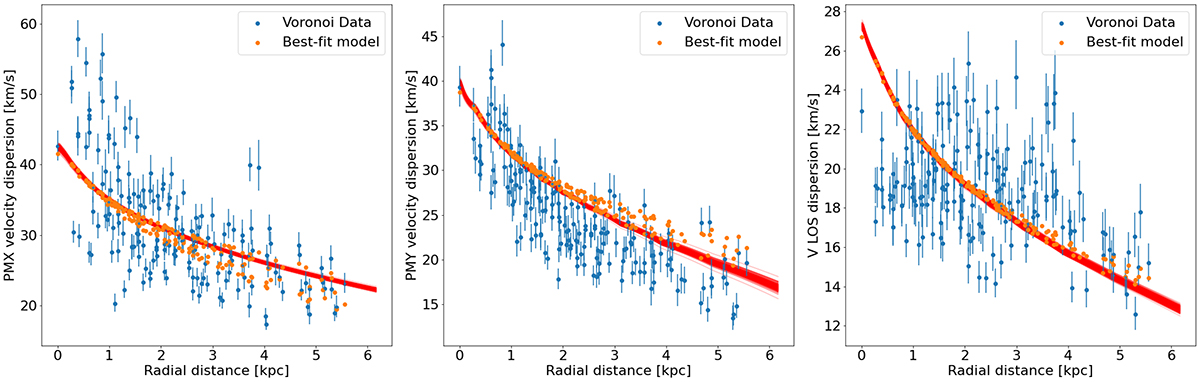
Projected velocity dispersion profile of the LMC in the three cardinal directions. The blue points show the maximum likelihood velocity dispersion in each of the Voronoi bins defined in Fig. 8. The yellow points show the corresponding velocity dispersions of the best-fit 3D Jeans model in the same Voronoi bins. The read lines show 150 random draws from the model posterior distribution along the horizontal axis.
Current usage metrics show cumulative count of Article Views (full-text article views including HTML views, PDF and ePub downloads, according to the available data) and Abstracts Views on Vision4Press platform.
Data correspond to usage on the plateform after 2015. The current usage metrics is available 48-96 hours after online publication and is updated daily on week days.
Initial download of the metrics may take a while.