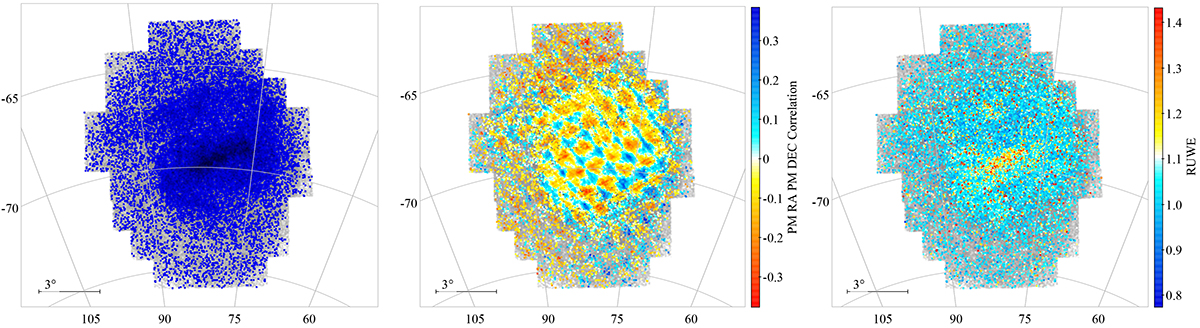
Fig. 2.
Download original image
Spatial distribution and quality control. Left panel: Density distribution of the selected LMC targets with 3D kinematics (blue) with the larger sample of stars with good PM measurements plotted under with light grey dots. Middle panel: Similar to the left panel but the stars with 3D kinematics are colour-coded according to the μRA μDec correlation coefficient. Right panel: Stars with 3D kinematics colour-coded according to the RUWE index.
Current usage metrics show cumulative count of Article Views (full-text article views including HTML views, PDF and ePub downloads, according to the available data) and Abstracts Views on Vision4Press platform.
Data correspond to usage on the plateform after 2015. The current usage metrics is available 48-96 hours after online publication and is updated daily on week days.
Initial download of the metrics may take a while.