Fig. 10.
Download original image
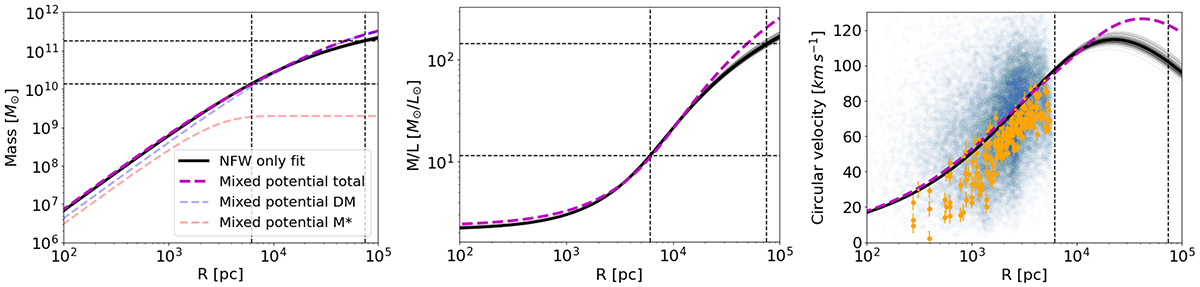
Cumulative mass (left panel), mass-to-light ratio (middle panel), and rotation curve (right panel) of the LMC according to best-fit NFW only (black) and mixed (magenta) gravitational potentials of the axisymmetric Jeans model. The vertical dashed lines denote the extent of the kinematic tracers and the viral radius (R200) and the horizontal lines denote the enclosed mass and mass-to-light ratio within these radii. In the rotation curve plot, we overlay the total mean velocity of each Voronoi bin defined in Fig. 6 as orange dots, as well as the total velocity of all LMC member stars as a transparent blue cloud.
Current usage metrics show cumulative count of Article Views (full-text article views including HTML views, PDF and ePub downloads, according to the available data) and Abstracts Views on Vision4Press platform.
Data correspond to usage on the plateform after 2015. The current usage metrics is available 48-96 hours after online publication and is updated daily on week days.
Initial download of the metrics may take a while.