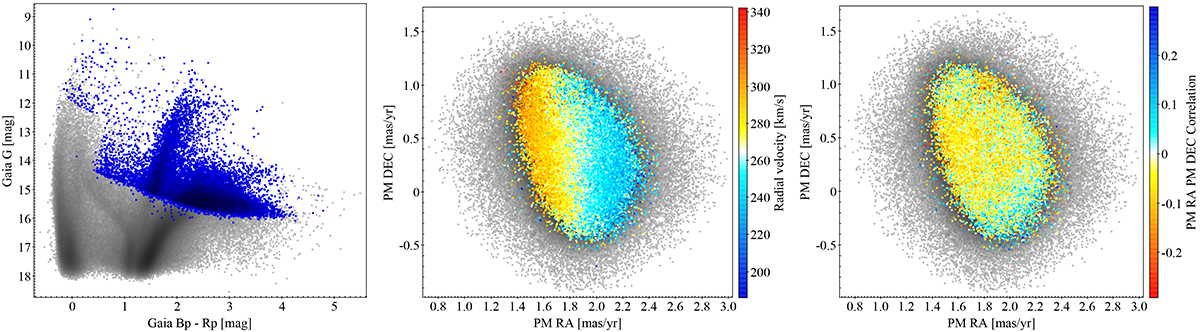
Fig. 1.
Download original image
Data selection. Left panel: Gaia CMD of the selected LMC targets with 3D kinematics (blue). Middle panel: PM vector diagram of the LMC sources with 3D kinematics, colour-coded by the LOS velocity. Right panel: Same as the middle panel but colour-coded by the μRA μDec correlation coefficient. The grey points in all panels show additional LMC sources with good Gaia PM measurements (μerr < 0.1 mas yr−1) but no LOS velocity entries. These are the sources used in our 2D Jeans model.
Current usage metrics show cumulative count of Article Views (full-text article views including HTML views, PDF and ePub downloads, according to the available data) and Abstracts Views on Vision4Press platform.
Data correspond to usage on the plateform after 2015. The current usage metrics is available 48-96 hours after online publication and is updated daily on week days.
Initial download of the metrics may take a while.