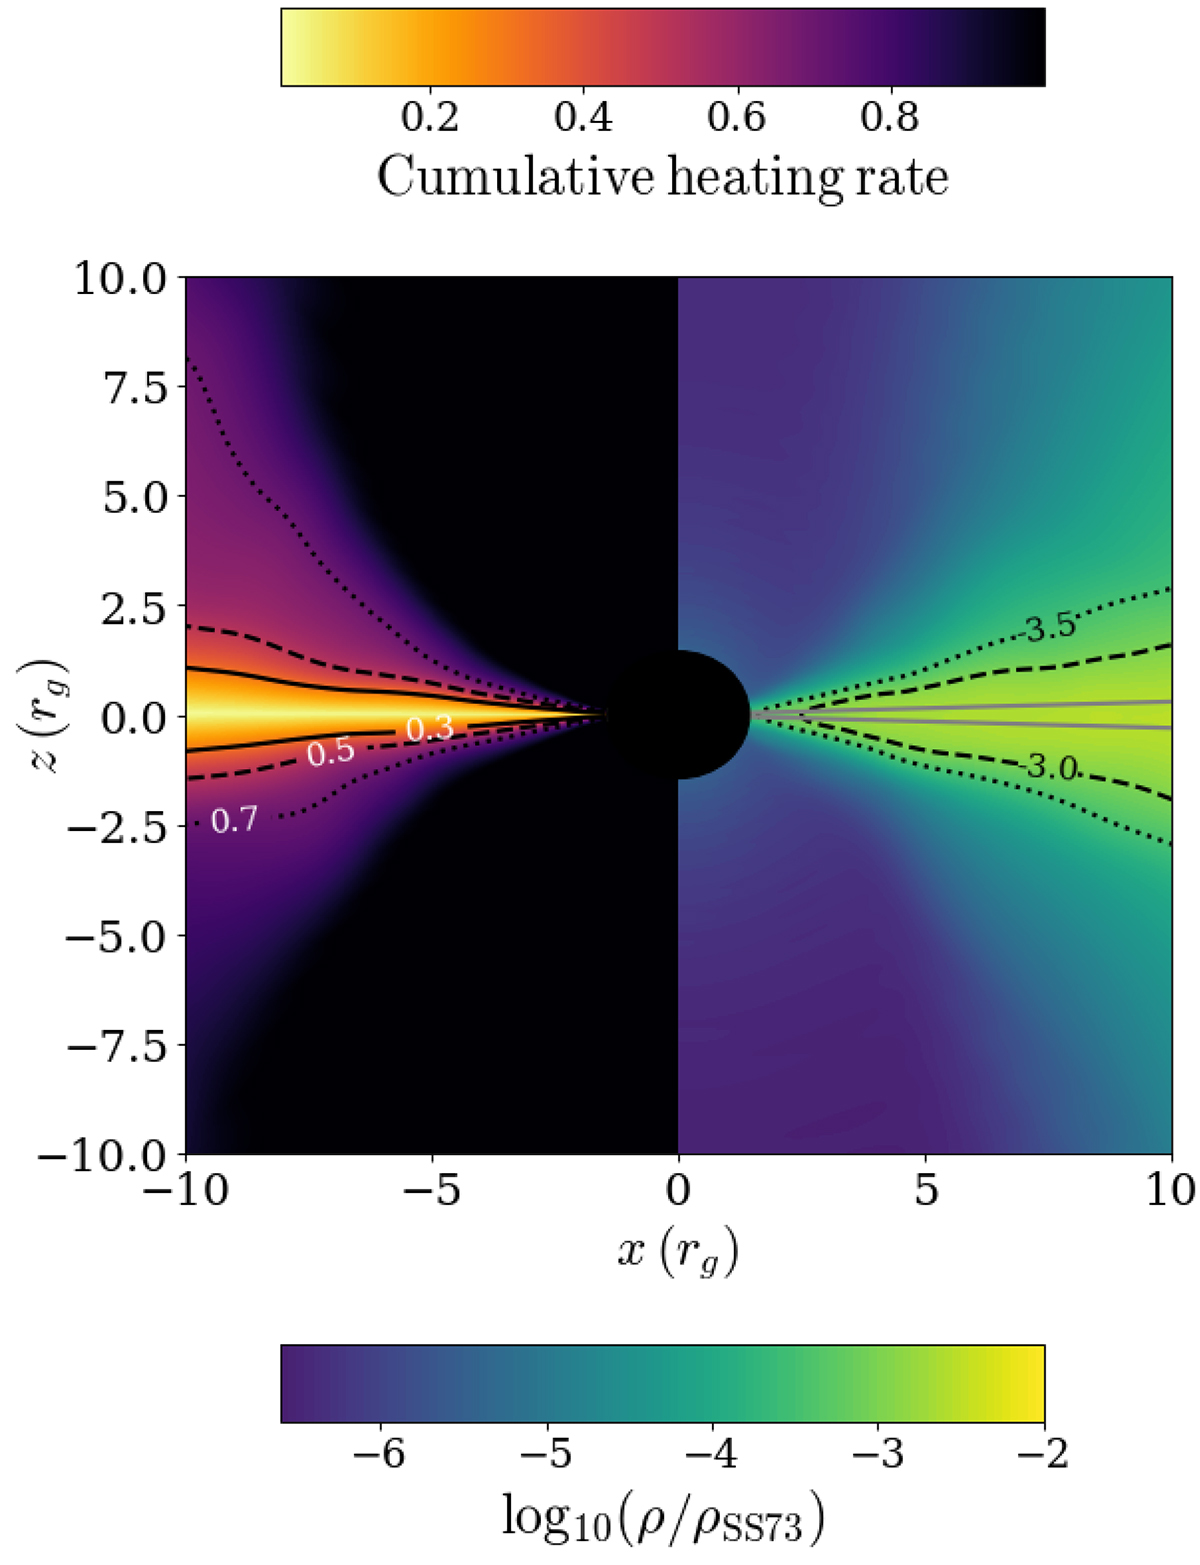
Fig. 2.
Download original image
Right panel: Time- and ϕ-averaged log of the density in the simulation of SBD24, normalized by the density in the midplane that would be obtained from the SS73 model with the same accretion rate, with α = 1 and hth/r = 0.03. The black lines show three contours of the color map. The gray lines show the surfaces of z/r = ±0.03. Left panel: Time- and ϕ-averaged cumulative heating rate, i.e., the ratio of the heating rate latitudinally integrated up to θ to the heating rate latitudinally integrated up to ∞. The black lines show three contours of the cumulative heating rate.
Current usage metrics show cumulative count of Article Views (full-text article views including HTML views, PDF and ePub downloads, according to the available data) and Abstracts Views on Vision4Press platform.
Data correspond to usage on the plateform after 2015. The current usage metrics is available 48-96 hours after online publication and is updated daily on week days.
Initial download of the metrics may take a while.