Fig. A.1
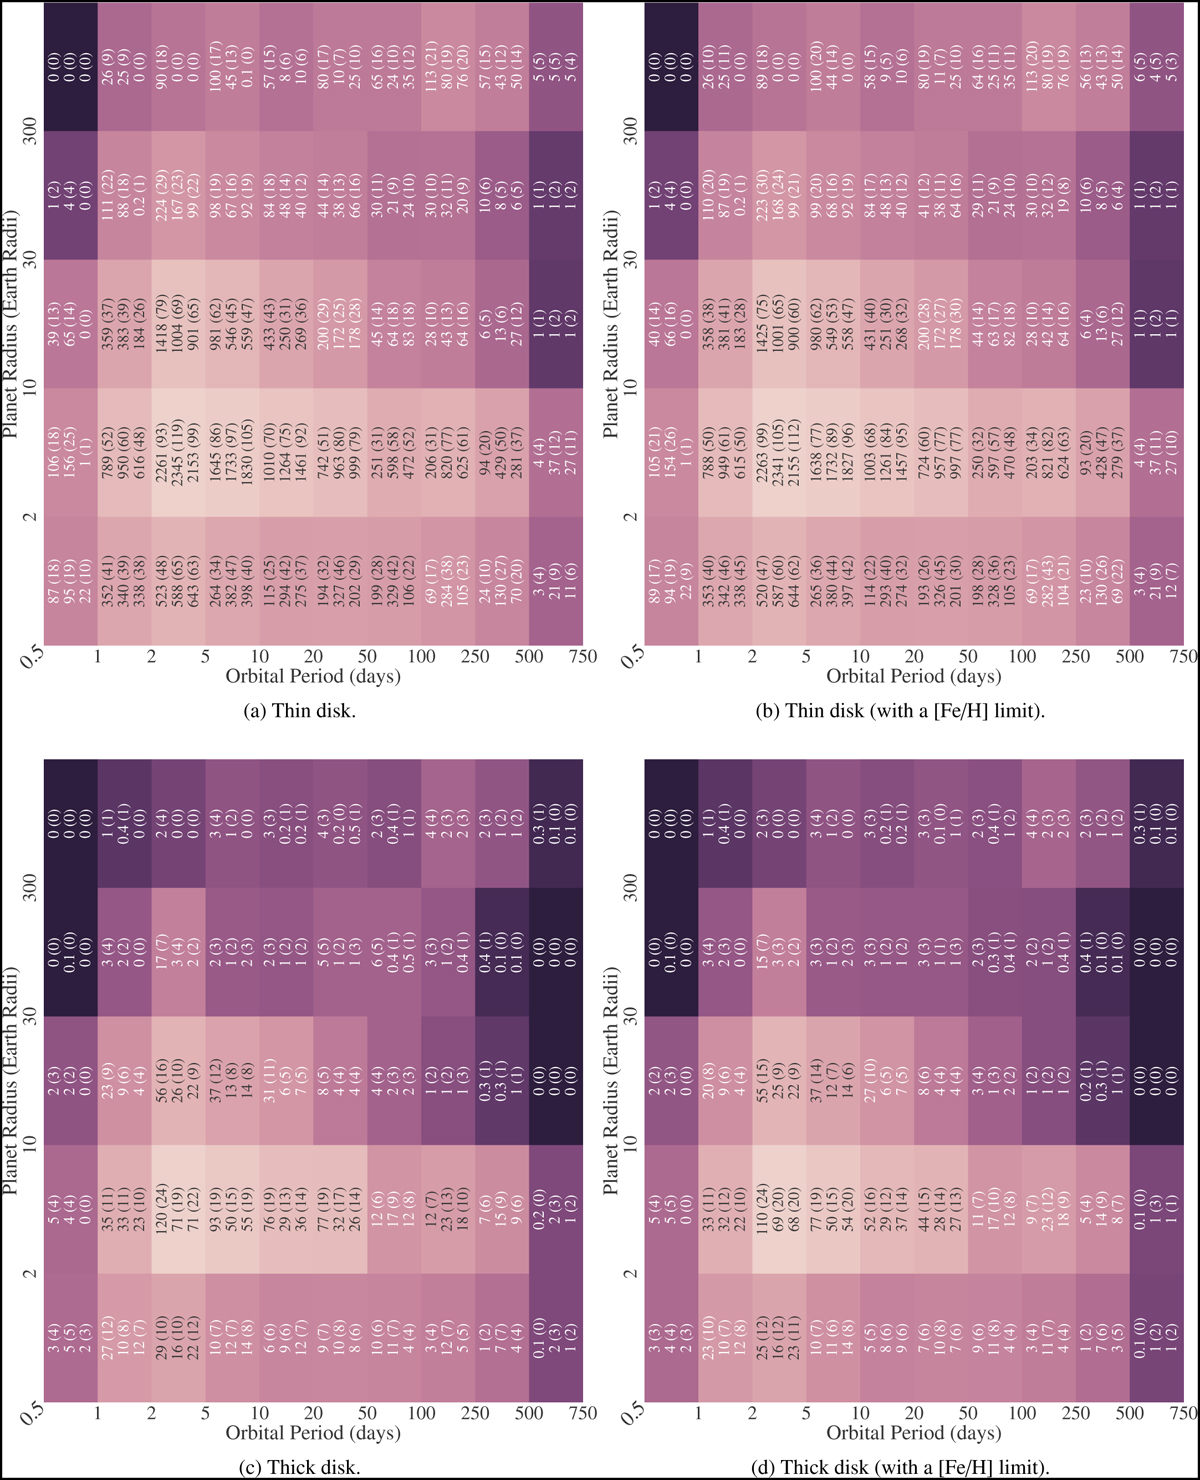
Download original image
Heat maps of the expected number of observed planets in across the LOPS2 and LOPN1 fields for a 2+2 year observation strategy, as a function of orbital period and planet radius. The numbers in each bin represent the mean and the interquartile range (16th to 84th percentile) for 300 mock observations, for NEmbryo = [10, 50, 100] (top to bottom). The heat maps on the right side (b, d, f) enforce a minimum stellar metallicity of [Fe/H] = −0.6, below which no planets can form as suggested by Andama et al. (2024). Note that these estimates are only for the targets we were able to classify into one of the three components (see Table 1), not considering stars that were categorised as thick disk or halo candidates, or those removed in the sample selection process (Sect. 2.1).
Current usage metrics show cumulative count of Article Views (full-text article views including HTML views, PDF and ePub downloads, according to the available data) and Abstracts Views on Vision4Press platform.
Data correspond to usage on the plateform after 2015. The current usage metrics is available 48-96 hours after online publication and is updated daily on week days.
Initial download of the metrics may take a while.