Fig. A.2
Download original image
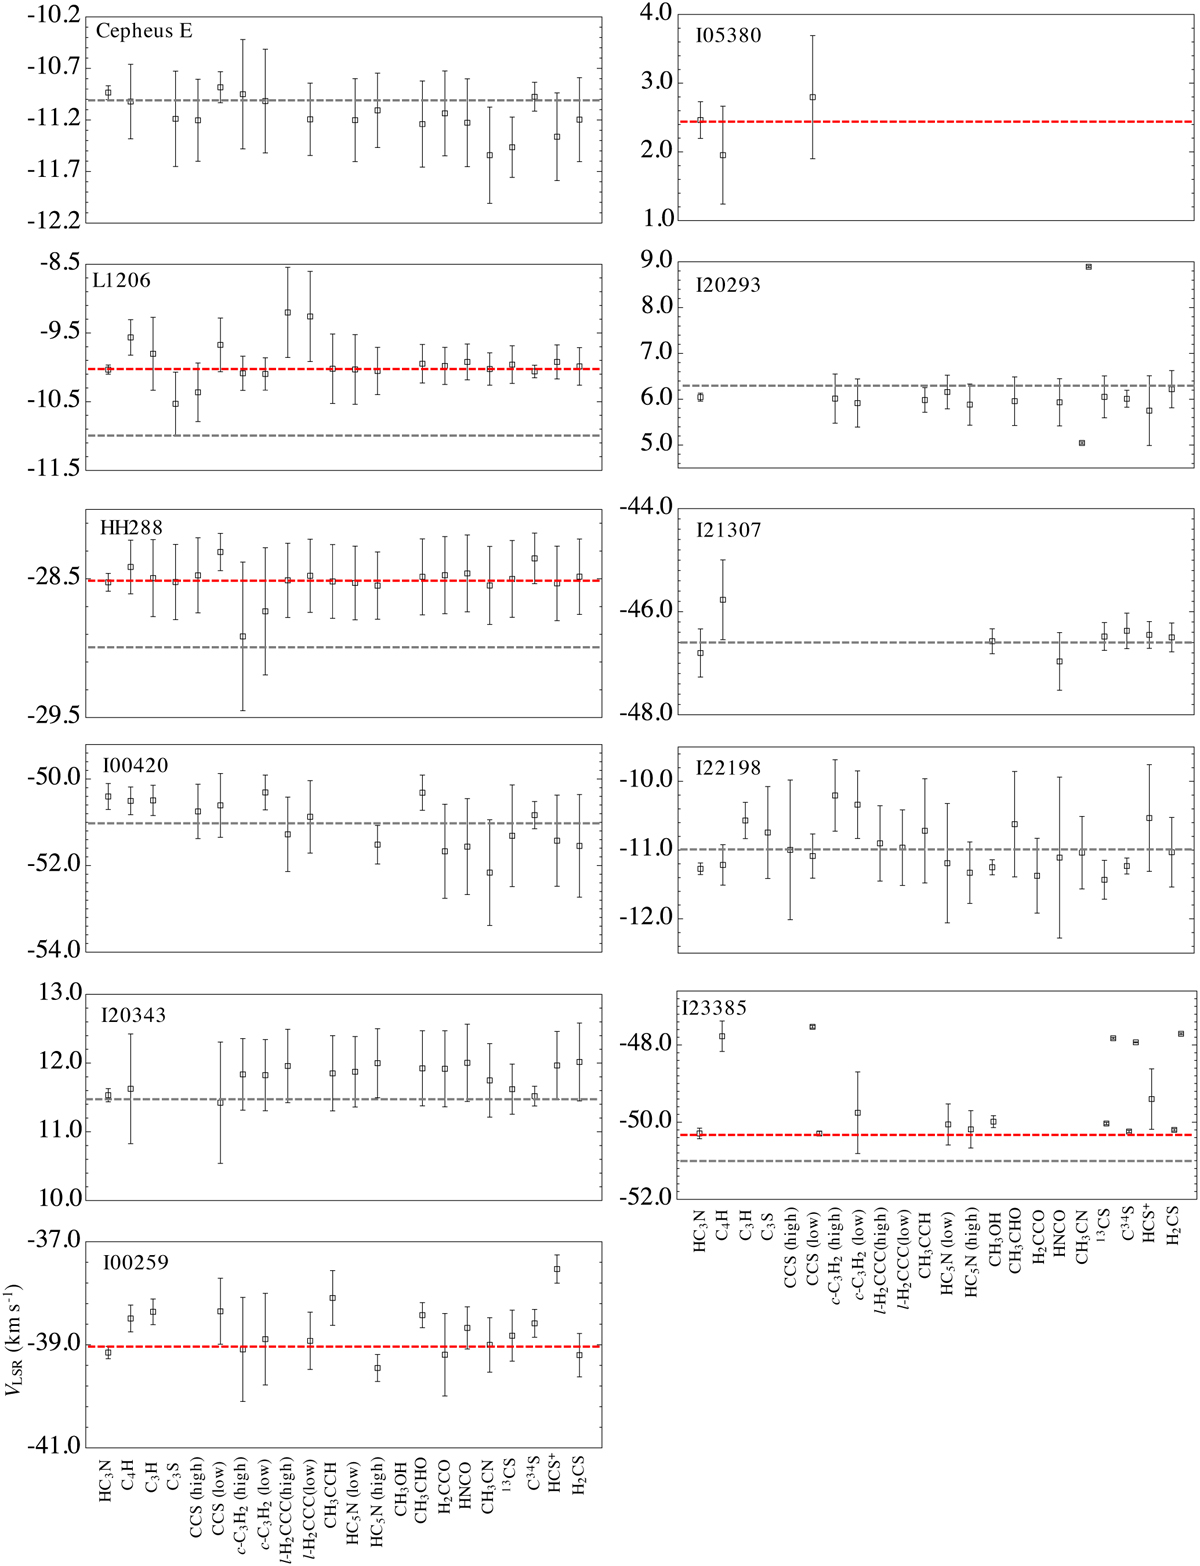
Comparison of the centroid velocity (VLSR) obtained via the MCMC analyses. The error bars do not include the velocity resolution of spectra (≈0.3 km s−1). The dashed gray horizontal lines indicate the systemic velocity of the source (Table 1). The dashed red horizontal lines indicate the systemic velocity updated or reported based on our results.
Current usage metrics show cumulative count of Article Views (full-text article views including HTML views, PDF and ePub downloads, according to the available data) and Abstracts Views on Vision4Press platform.
Data correspond to usage on the plateform after 2015. The current usage metrics is available 48-96 hours after online publication and is updated daily on week days.
Initial download of the metrics may take a while.