Fig. 2
Download original image
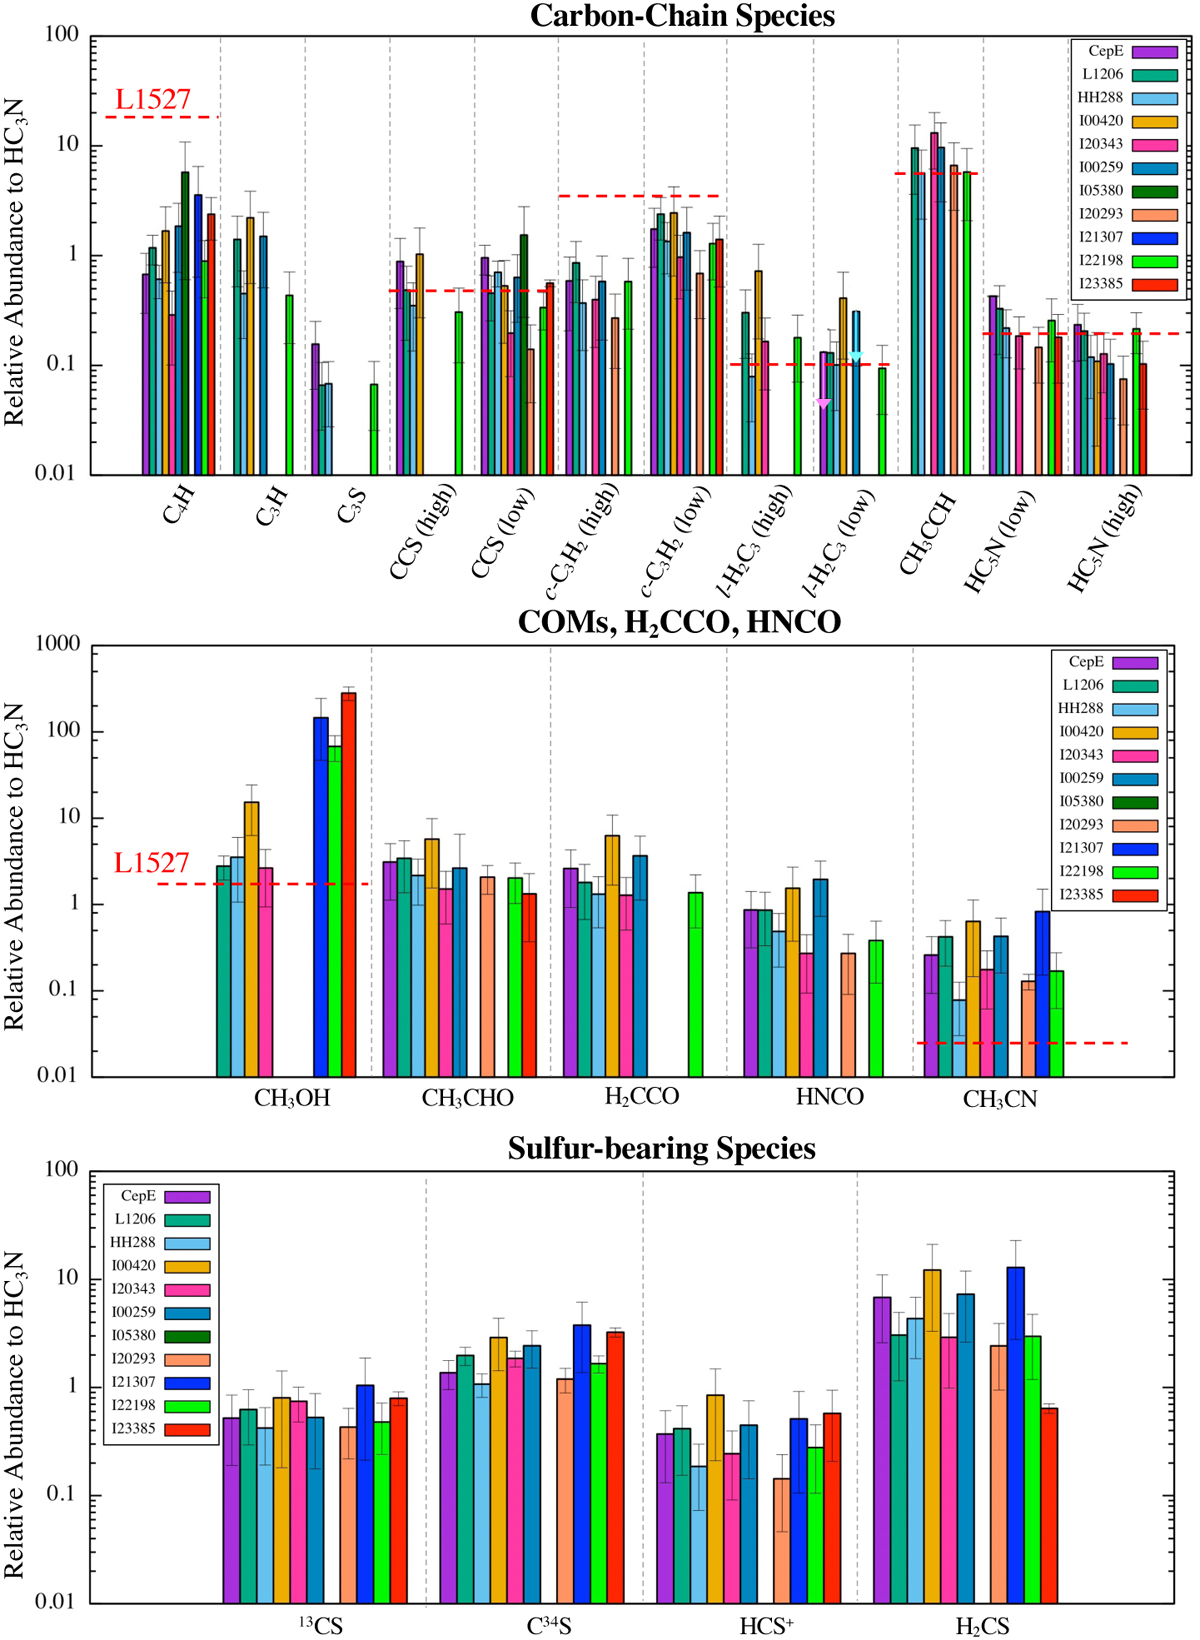
Comparison of molecular abundances with respect to HC3N for: carbon-chain species (top), COMs, H2CCO, and HNCO (middle), and S-bearing species (bottom). Errors indicate the standard deviation. In the caption, "high" and "low" indicate the high and low temperatures components. The dashed red lines mark the abundance ratios for the low-mass WCCC source L1527 (Yoshida et al. 2019).
Current usage metrics show cumulative count of Article Views (full-text article views including HTML views, PDF and ePub downloads, according to the available data) and Abstracts Views on Vision4Press platform.
Data correspond to usage on the plateform after 2015. The current usage metrics is available 48-96 hours after online publication and is updated daily on week days.
Initial download of the metrics may take a while.