Fig. 2
Download original image
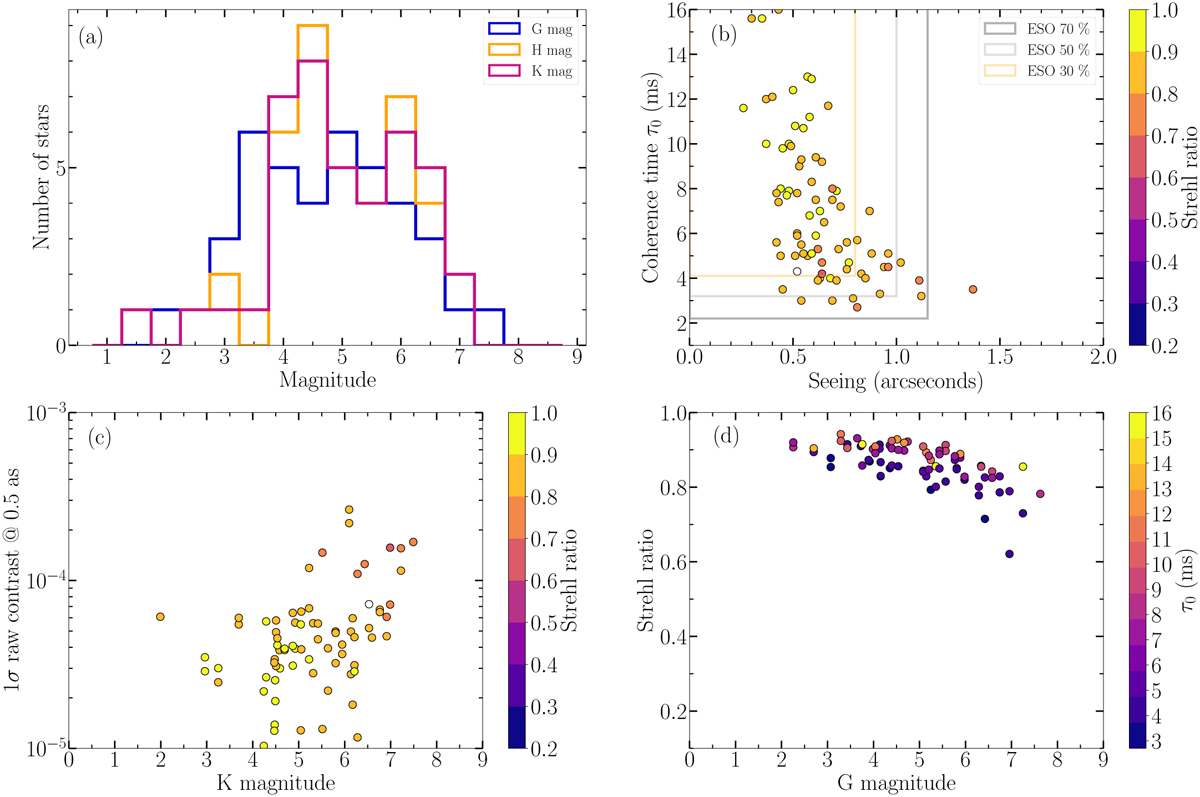
Sample properties and observing conditions. (a) Histogram of the star magnitudes (G, H, and K) for the sample considered in this study. (b) Scatter plot showing the coherence time (τ0) against the seeing with the Strehl ratio color-coded. Data points without Strehl information are colored in white. The boxes delimit the ESO observing categories. (c) Scatter plot showing the 1 sigma raw contrast measured at a separation of 0.5″ (directly measured on the coronographic frame, before post-processing) with respect to the K-band star apparent magnitude. (d) Scatter plot displaying the Strehl ratio as a function of the star apparent magnitude in the G band.
Current usage metrics show cumulative count of Article Views (full-text article views including HTML views, PDF and ePub downloads, according to the available data) and Abstracts Views on Vision4Press platform.
Data correspond to usage on the plateform after 2015. The current usage metrics is available 48-96 hours after online publication and is updated daily on week days.
Initial download of the metrics may take a while.