Fig. A.1.
Download original image
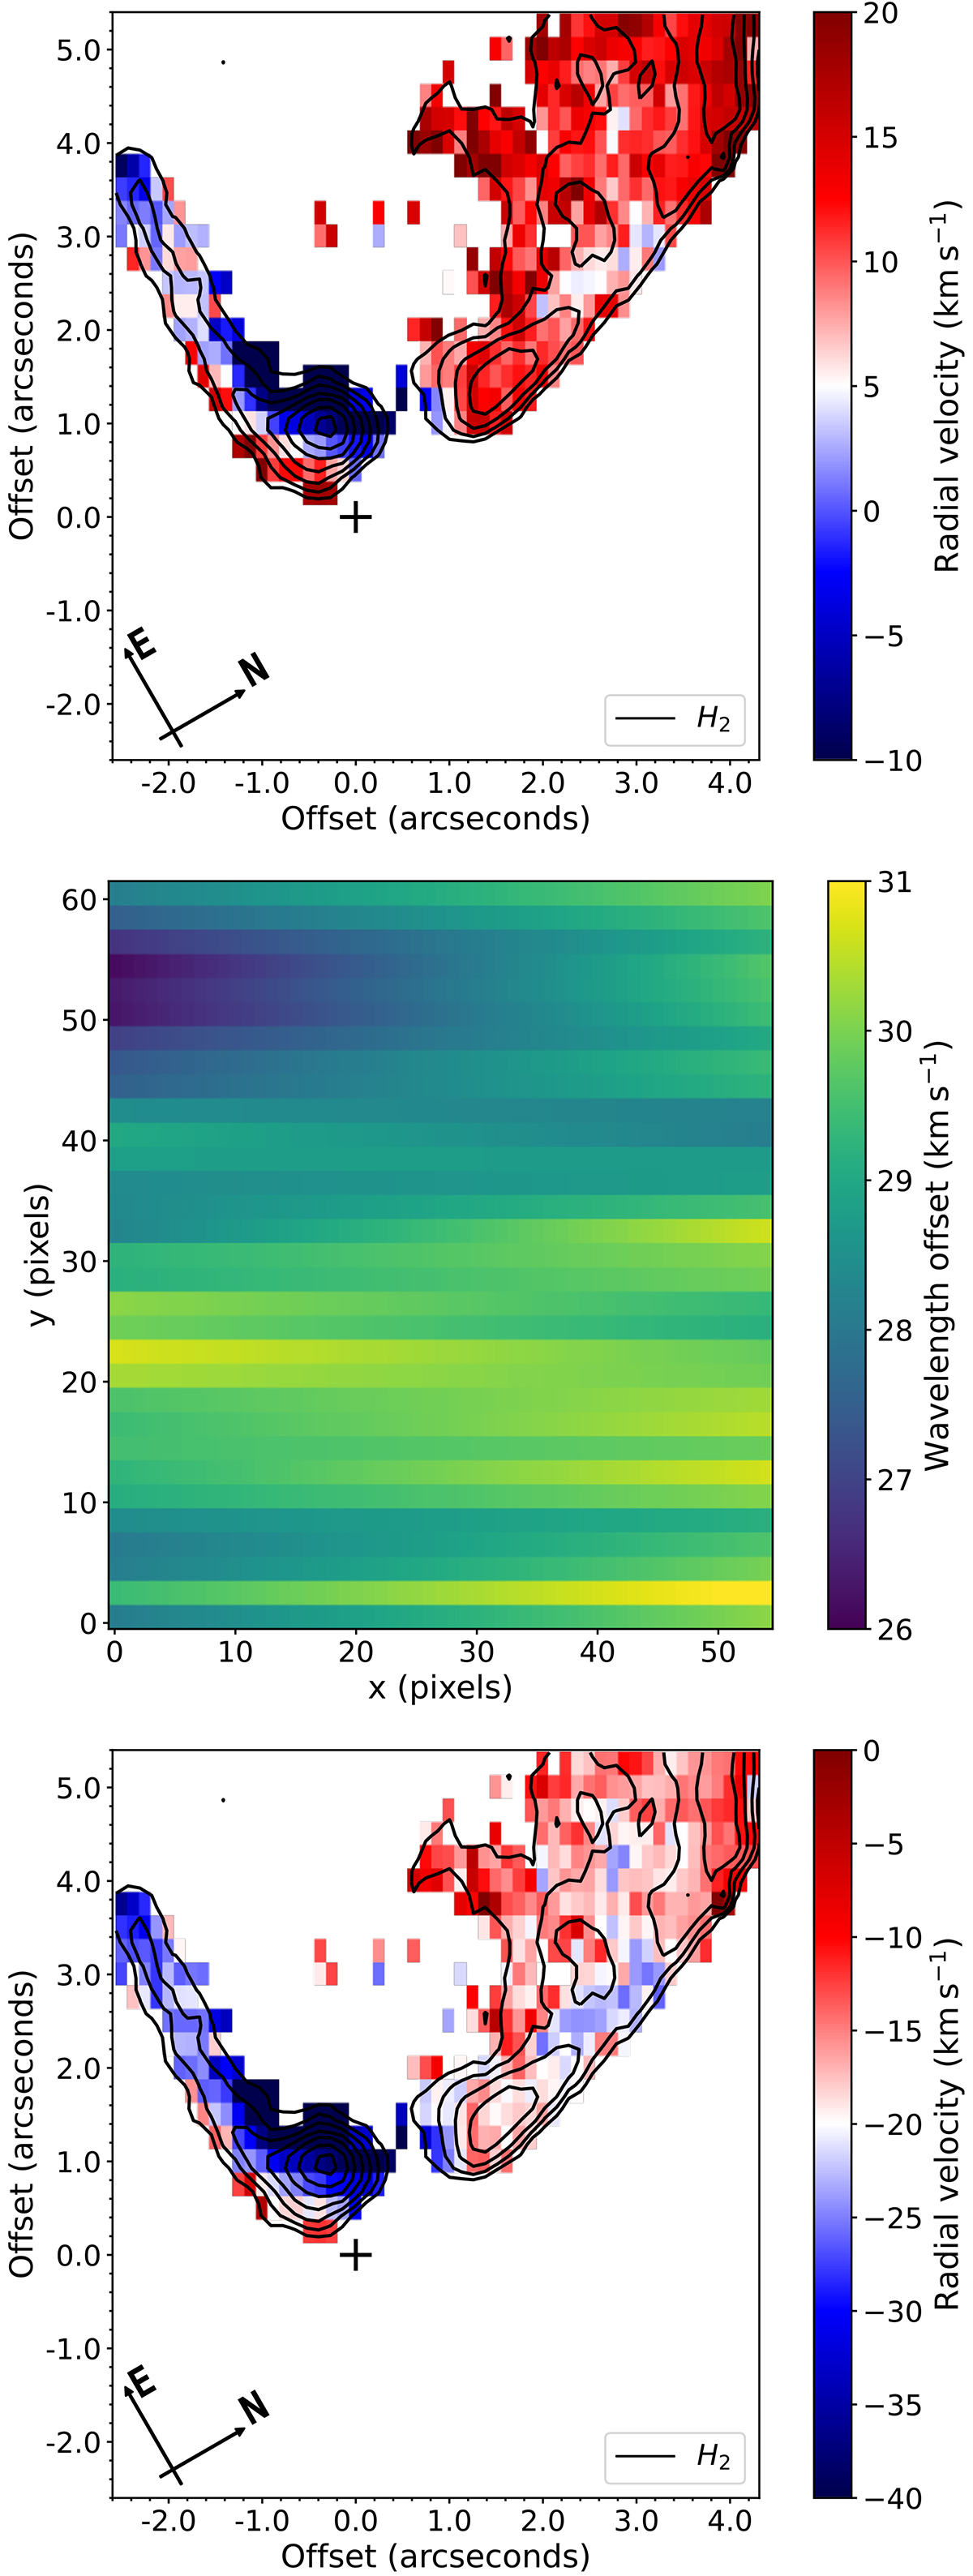
Velocity centroid maps of H2 emission before (top), and after (bottom), the wavelength recalibration map (centre), derived from the OH emission lines, is applied. Notice the change in velocity scales used for the velocity centroid maps. The source position is represented with a black plus symbol in the velocity centroid maps. Contour levels for both begin at 3σ of the background emission and increase by factors of 1.5.
Current usage metrics show cumulative count of Article Views (full-text article views including HTML views, PDF and ePub downloads, according to the available data) and Abstracts Views on Vision4Press platform.
Data correspond to usage on the plateform after 2015. The current usage metrics is available 48-96 hours after online publication and is updated daily on week days.
Initial download of the metrics may take a while.