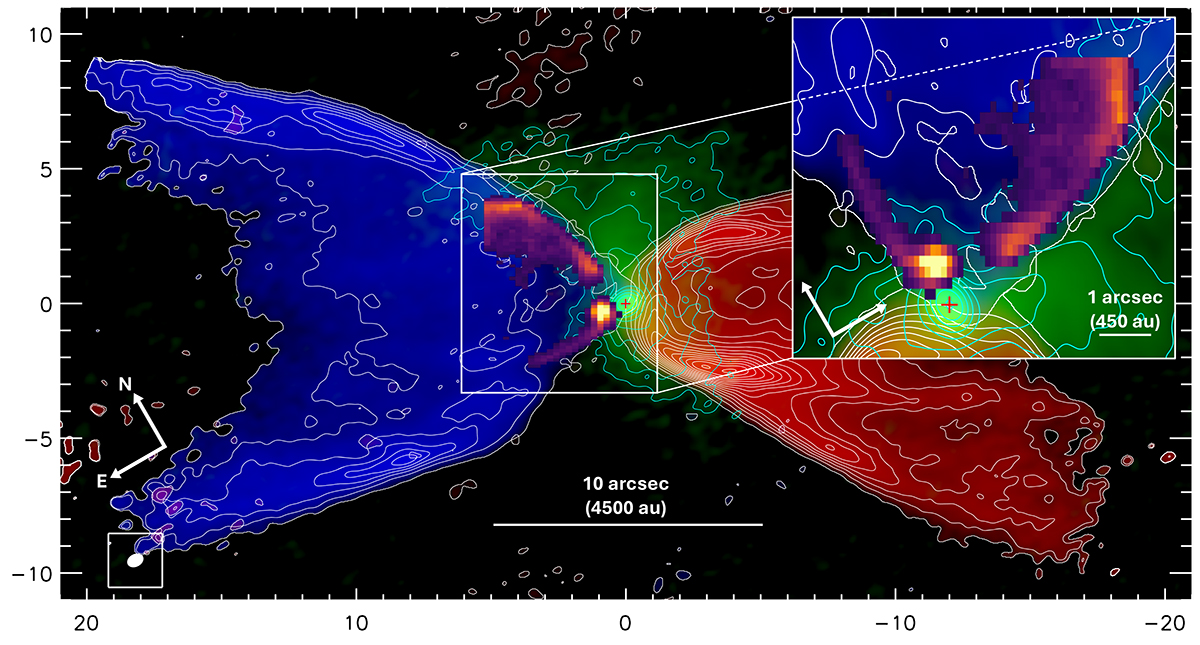
Fig. 8.
Download original image
SINFONI H2 emission overplotted on the blueshifted molecular outflow traced by 12CO(2−1) as observed by ALMA (Zhang et al. 2019). The blue area traces integrated CO emission from −35 km s−1 to −10 km s−1. The green area highlights the 1.3 mm dust continuum. The red area traces integrated CO emission from +10 km s−1 to +50 km s−1. The shocked cavity walls traced by H2 lie within the cavity structure seen in the CO emission. The red plus indicates the continuum peak position in the SINFONI data. An inset displays a zoomed image of the H2 emission overplotted on the blueshifted CO outflow to better illustrate that the H2 emission is nested within the CO outflow. This inset has been rotated clockwise by 90° to match the convention of figures presented in this paper, where the outflow axis is aligned with the vertical axis. Figure adapted from Zhang et al. (2019).
Current usage metrics show cumulative count of Article Views (full-text article views including HTML views, PDF and ePub downloads, according to the available data) and Abstracts Views on Vision4Press platform.
Data correspond to usage on the plateform after 2015. The current usage metrics is available 48-96 hours after online publication and is updated daily on week days.
Initial download of the metrics may take a while.