Fig. 6.
Download original image
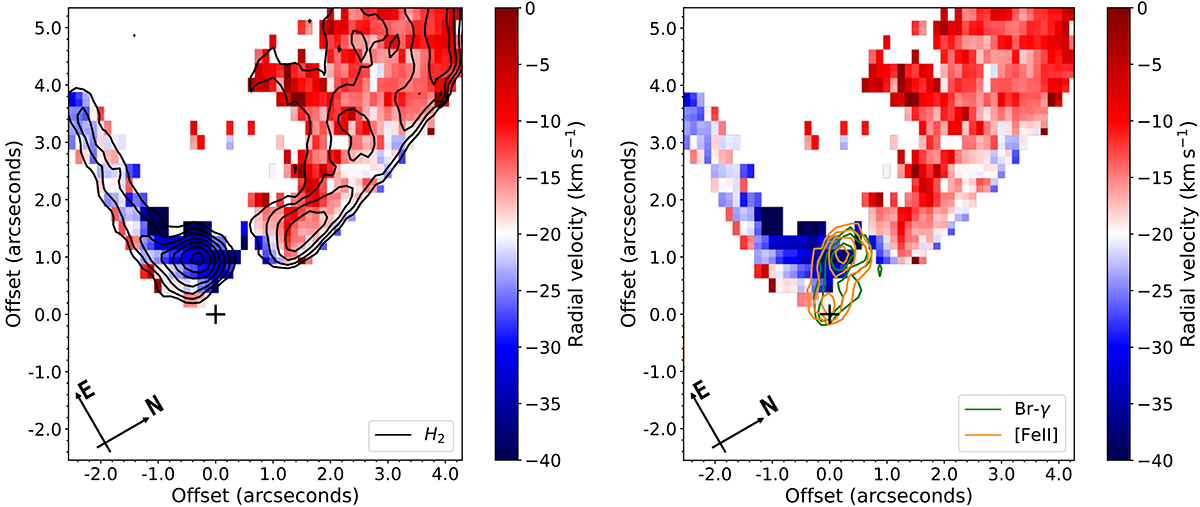
Scattered light-corrected H2 emission radial velocity centroid maps. The source position is marked by a black plus symbol. The radial velocity centroid maps display a clear velocity gradient between both sides of the V-shaped cavity. The left side of the cavity has, on average, a greater radial velocity when compared with the right side. The difference in velocity between both sides is ∼10 km s−1. Contour levels for both begin at 3σ of the background emission and increase by factors of 1.5. Left: H2 velocity centroid map with integrated H2 emission overplotted in black contour lines. Right: Same H2 velocity centroid map but with overlayed plots of jet-tracing integrated [Fe II] emission (in orange contours) and integrated Br-γ emission (in green contours). The jet flows between both sides of the cavity traced by H2.
Current usage metrics show cumulative count of Article Views (full-text article views including HTML views, PDF and ePub downloads, according to the available data) and Abstracts Views on Vision4Press platform.
Data correspond to usage on the plateform after 2015. The current usage metrics is available 48-96 hours after online publication and is updated daily on week days.
Initial download of the metrics may take a while.