Fig. 5.
Download original image
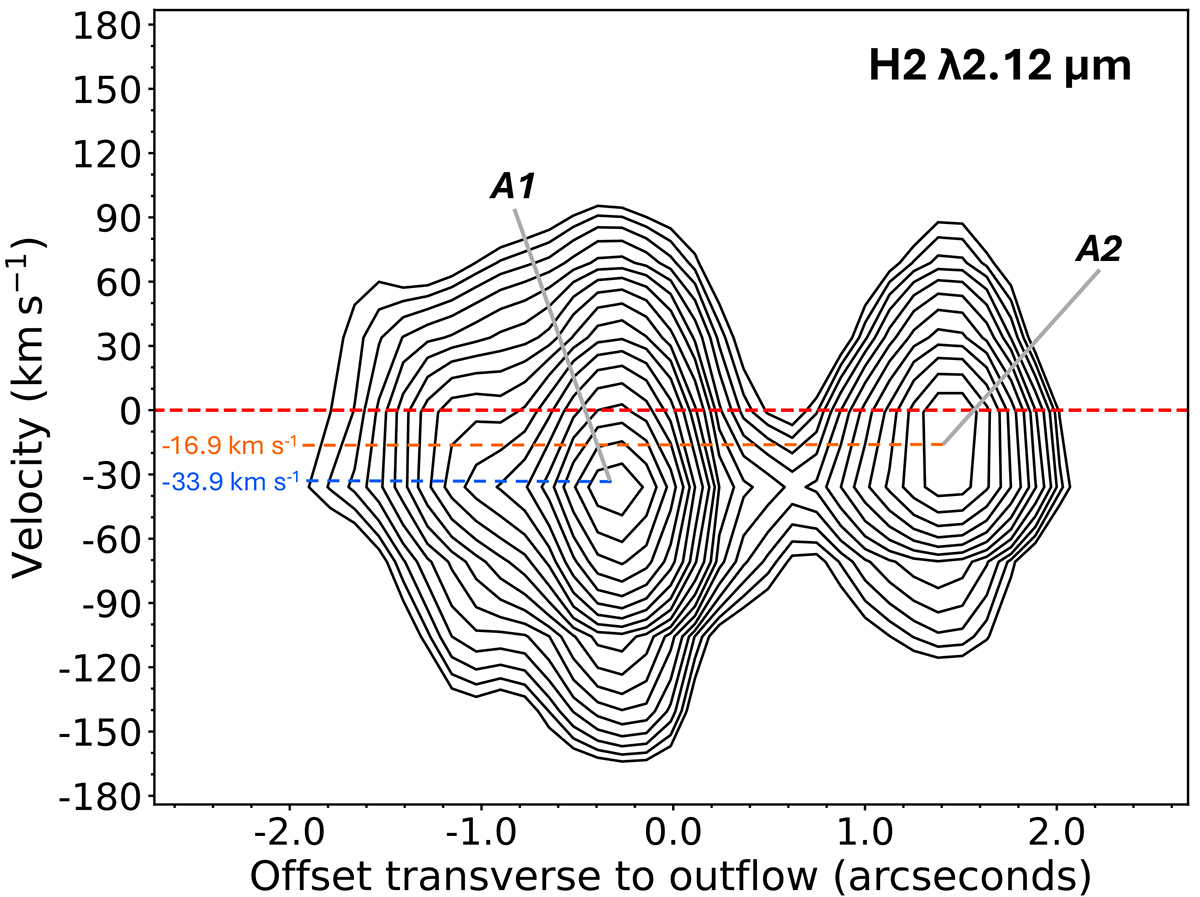
Transverse PV diagram of the H2 emission line region extracted at a projected z of ![]() and with a pseudo slit width of
and with a pseudo slit width of ![]() . The radial velocity of the molecular emission is much lower than that of the atomic emission. Two emission peaks can be seen on either side of the source position, labelled A1 and A2. The emission peak on the left side of the cavity (A1) has a slightly higher radial velocity of −33.9 km s−1 than the emission peak on the right side of the cavity (A2) at −16.9 km s−1. This hints at the presence of a velocity gradient transverse to the outflow direction in the cavity. Contour levels begin at 3σ of the background emission and increase by factors of 1.2.
. The radial velocity of the molecular emission is much lower than that of the atomic emission. Two emission peaks can be seen on either side of the source position, labelled A1 and A2. The emission peak on the left side of the cavity (A1) has a slightly higher radial velocity of −33.9 km s−1 than the emission peak on the right side of the cavity (A2) at −16.9 km s−1. This hints at the presence of a velocity gradient transverse to the outflow direction in the cavity. Contour levels begin at 3σ of the background emission and increase by factors of 1.2.
Current usage metrics show cumulative count of Article Views (full-text article views including HTML views, PDF and ePub downloads, according to the available data) and Abstracts Views on Vision4Press platform.
Data correspond to usage on the plateform after 2015. The current usage metrics is available 48-96 hours after online publication and is updated daily on week days.
Initial download of the metrics may take a while.