Fig. 4.
Download original image
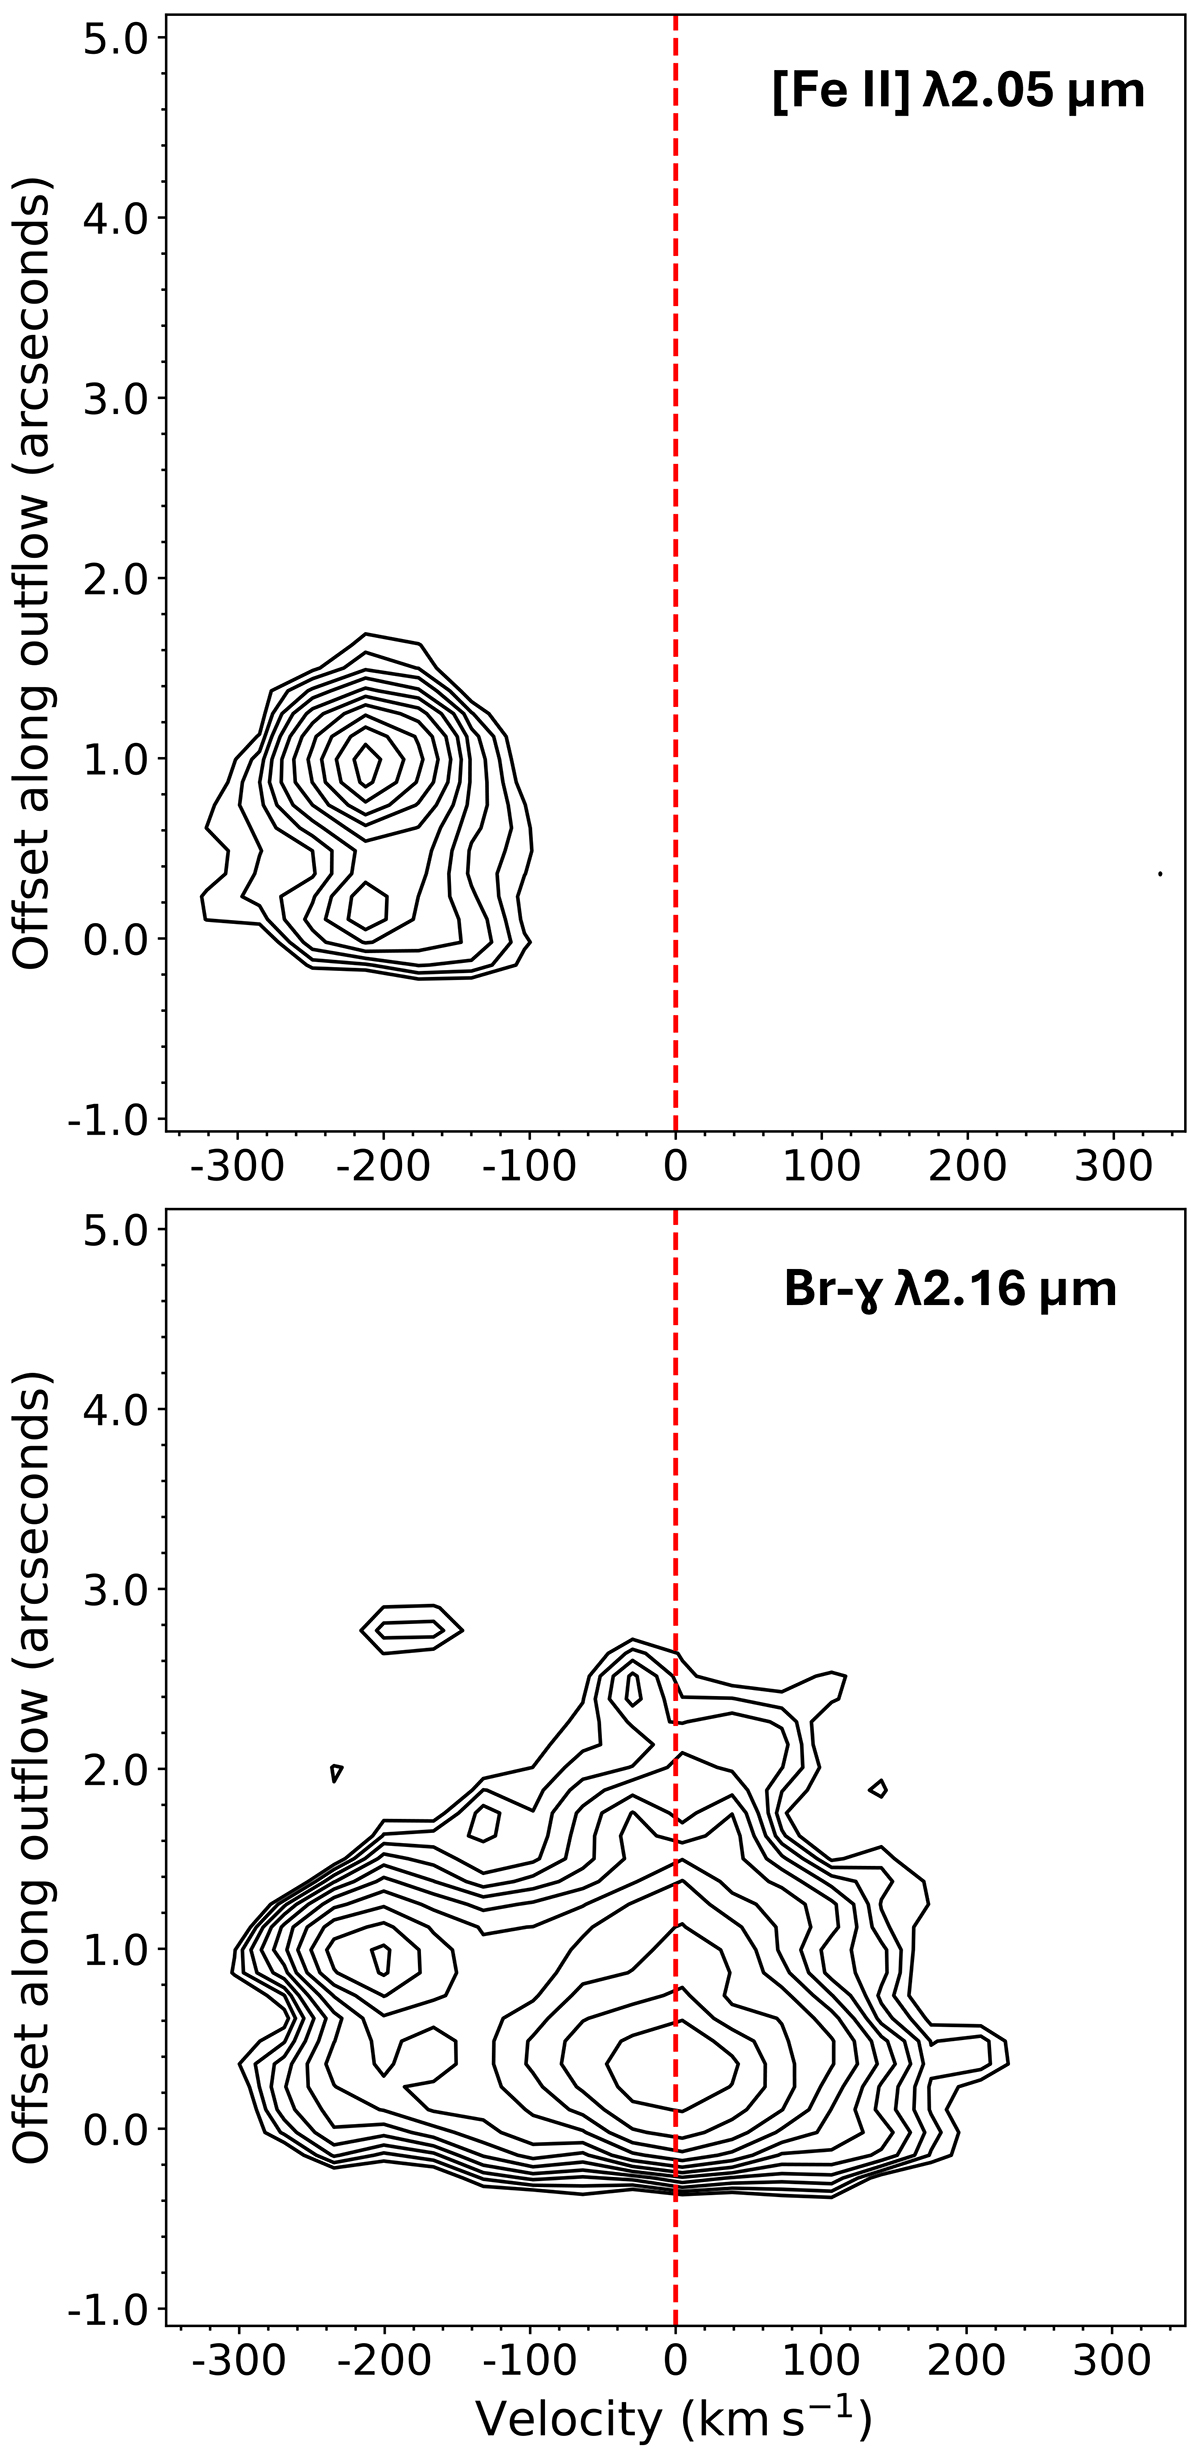
Position velocity diagrams extracted along the outflow axis (PA = 60°) with a pseudo slit width of 1″. Upper panel: Position velocity diagram of the [Fe II] emission line region. The emission is traced from the source at 0″ and culminates in a bow shock at ![]() (450 au). The radial velocity of the jet emission traced in this line peaks at approximately −200 km s−1, in agreement with previous observations. Lower panel: Position velocity diagram of the Brackett-γ emission line region. The emission is again traced from the source and culminates in a bow shock at
(450 au). The radial velocity of the jet emission traced in this line peaks at approximately −200 km s−1, in agreement with previous observations. Lower panel: Position velocity diagram of the Brackett-γ emission line region. The emission is again traced from the source and culminates in a bow shock at ![]() (450 au). The radial velocity of the jet emission traced in this line peaks at approximately −200 km s−1. The spatially extended low-velocity Br-γ emission here, that is, the emission centred around 0 km s−1 and having a full width extending to approximately ±180 km s−1, is not intrinsic emission, it is instead light scattered off of the nebulous cavity material. Contour levels for both begin at 3σ of the background emission and increase by factors of 1.2. Velocities are expressed with respect to the LSR.
(450 au). The radial velocity of the jet emission traced in this line peaks at approximately −200 km s−1. The spatially extended low-velocity Br-γ emission here, that is, the emission centred around 0 km s−1 and having a full width extending to approximately ±180 km s−1, is not intrinsic emission, it is instead light scattered off of the nebulous cavity material. Contour levels for both begin at 3σ of the background emission and increase by factors of 1.2. Velocities are expressed with respect to the LSR.
Current usage metrics show cumulative count of Article Views (full-text article views including HTML views, PDF and ePub downloads, according to the available data) and Abstracts Views on Vision4Press platform.
Data correspond to usage on the plateform after 2015. The current usage metrics is available 48-96 hours after online publication and is updated daily on week days.
Initial download of the metrics may take a while.