Fig. 2.
Download original image
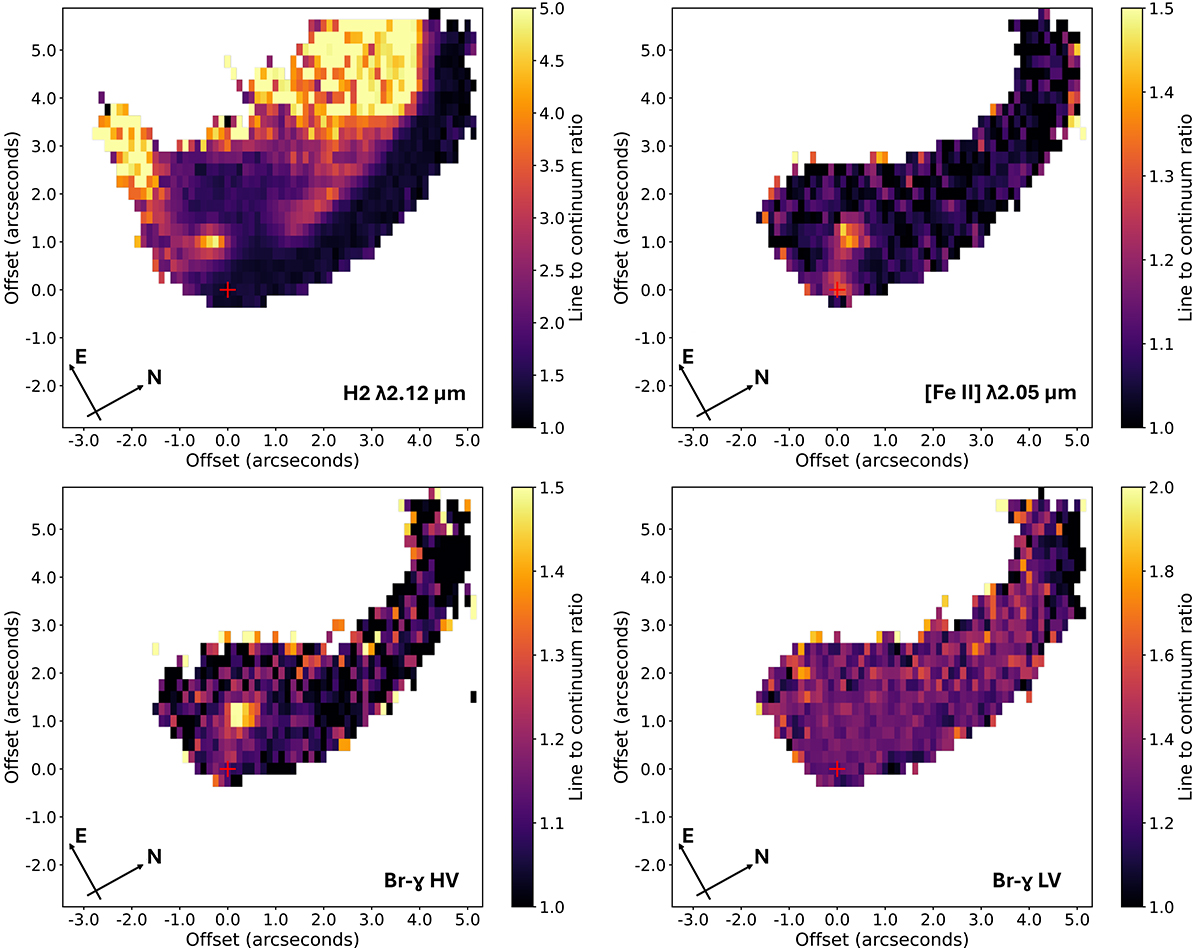
Line-to-continuum ratio plots of H2, [Fe II], and Br-γ emission. Intrinsic emission appears bright in these images, whereas scattered light is represented by a constant ratio close to unity. The source position is represented with a red plus symbol. A signal-to-noise threshold, set at three times the background noise, is implemented in these images to reject background emission, meaning the morphologies one sees in these figures is due to a combination of the continuum and the intrinsic line emission. Top left: Integrated H2 emission between −140 km s−1 and +60 km s−1 divided by nearby continuum. The intrinsic line emission here comes from the cavity walls and a H2 knot at the base of the left cavity wall (A1). Top right: Integrated [Fe II] emission between −310 km s−1 and −100 km s−1 divided by nearby continuum. The intrinsic line emission here traces the high-velocity atomic jet. Bottom left: Integrated high-velocity Br-γ emission between −230 km s−1 and −130 km s−1 divided by nearby continuum. The intrinsic line emission here again traces the high-velocity atomic jet. Bottom right: Integrated low-velocity Br-γ emission between −100 km s−1 and +100 km s−1 divided by nearby continuum. There is no spatially extended intrinsic emission detected here.
Current usage metrics show cumulative count of Article Views (full-text article views including HTML views, PDF and ePub downloads, according to the available data) and Abstracts Views on Vision4Press platform.
Data correspond to usage on the plateform after 2015. The current usage metrics is available 48-96 hours after online publication and is updated daily on week days.
Initial download of the metrics may take a while.