Fig. C.1.
Download original image
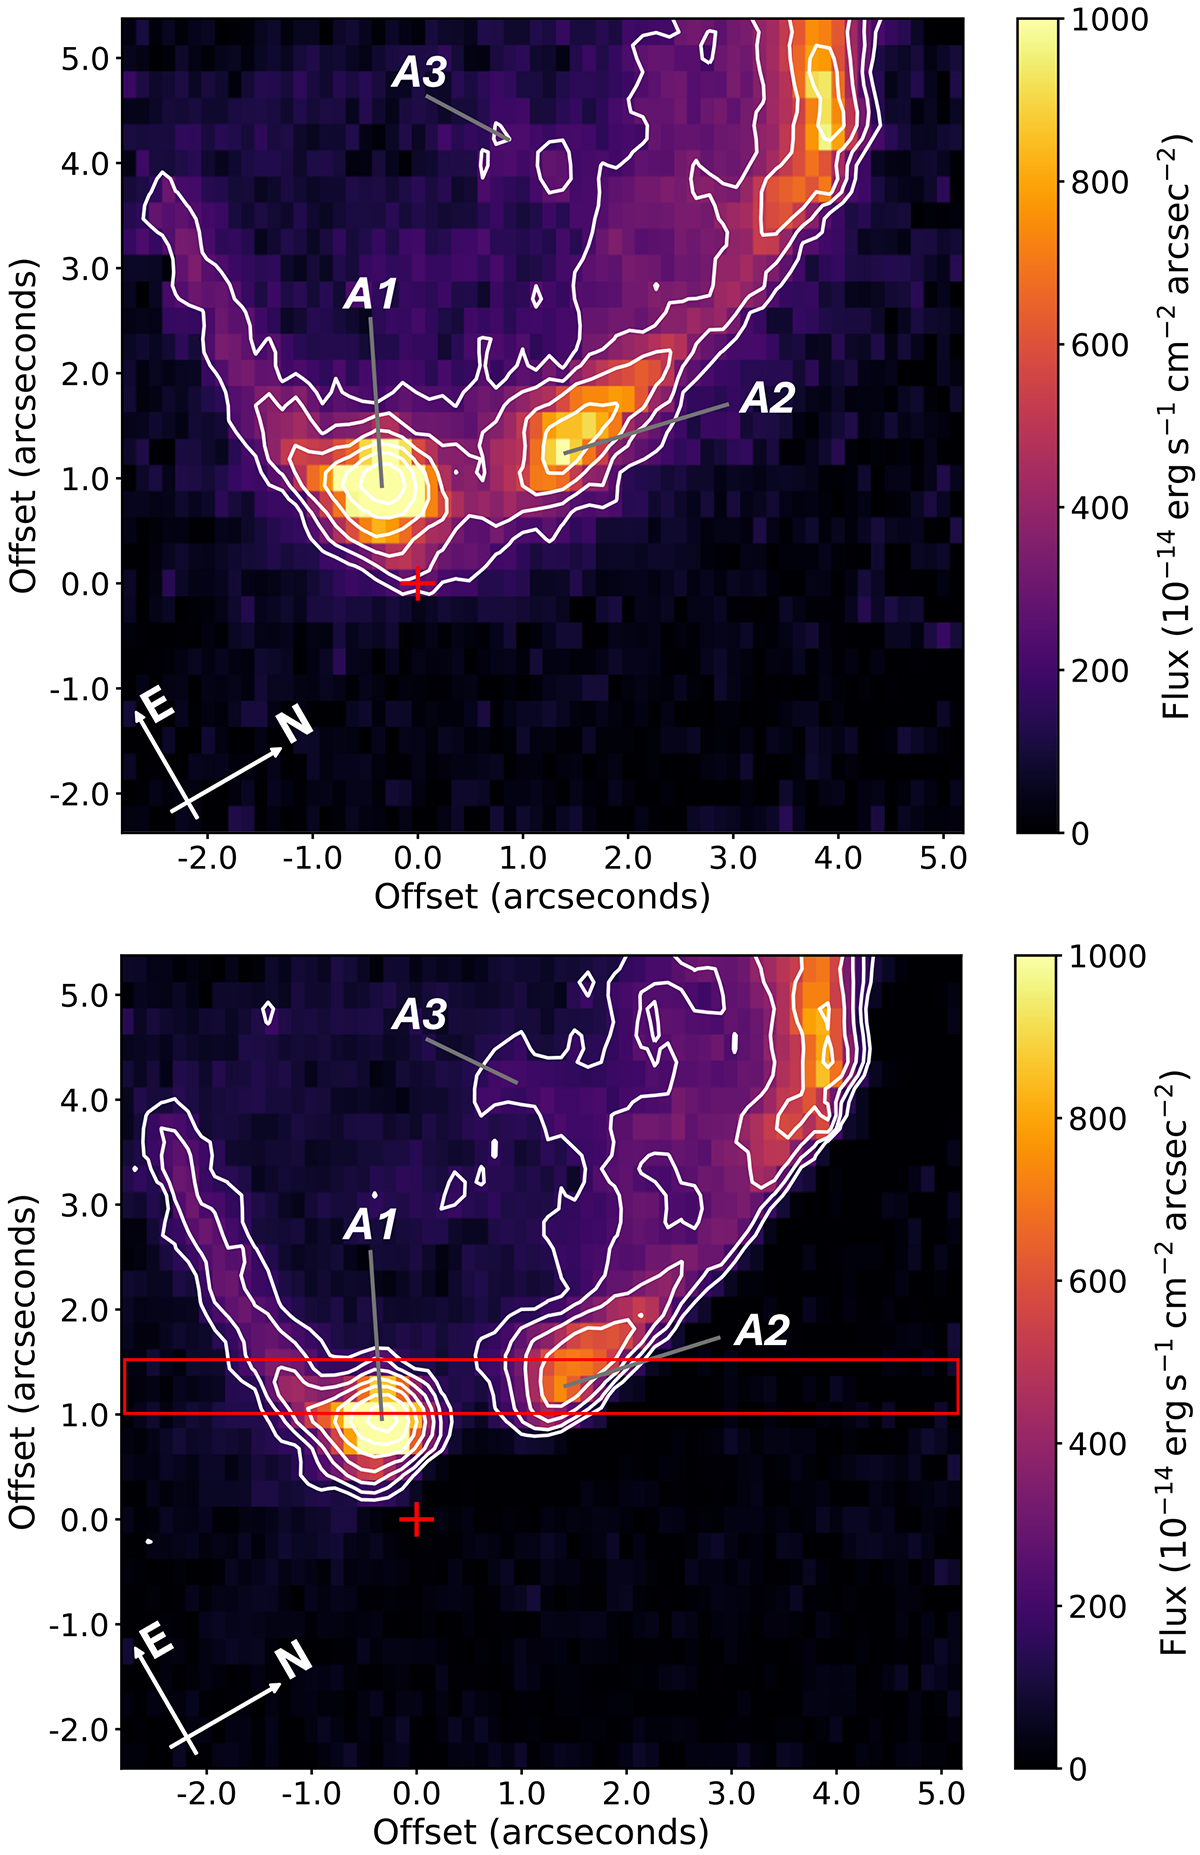
Integrated H2 line emission before (top) and after (bottom) the scattered emission removal routine is preformed. The source position is represented with a red plus symbol. Contour levels for both begin at 3σ of the background emission and increase by factors of 1.5. The red rectangle in the bottom panel displays the position and width of the pseudo-slit used to extract the transverse PV diagram seen in Fig. 5.
Current usage metrics show cumulative count of Article Views (full-text article views including HTML views, PDF and ePub downloads, according to the available data) and Abstracts Views on Vision4Press platform.
Data correspond to usage on the plateform after 2015. The current usage metrics is available 48-96 hours after online publication and is updated daily on week days.
Initial download of the metrics may take a while.