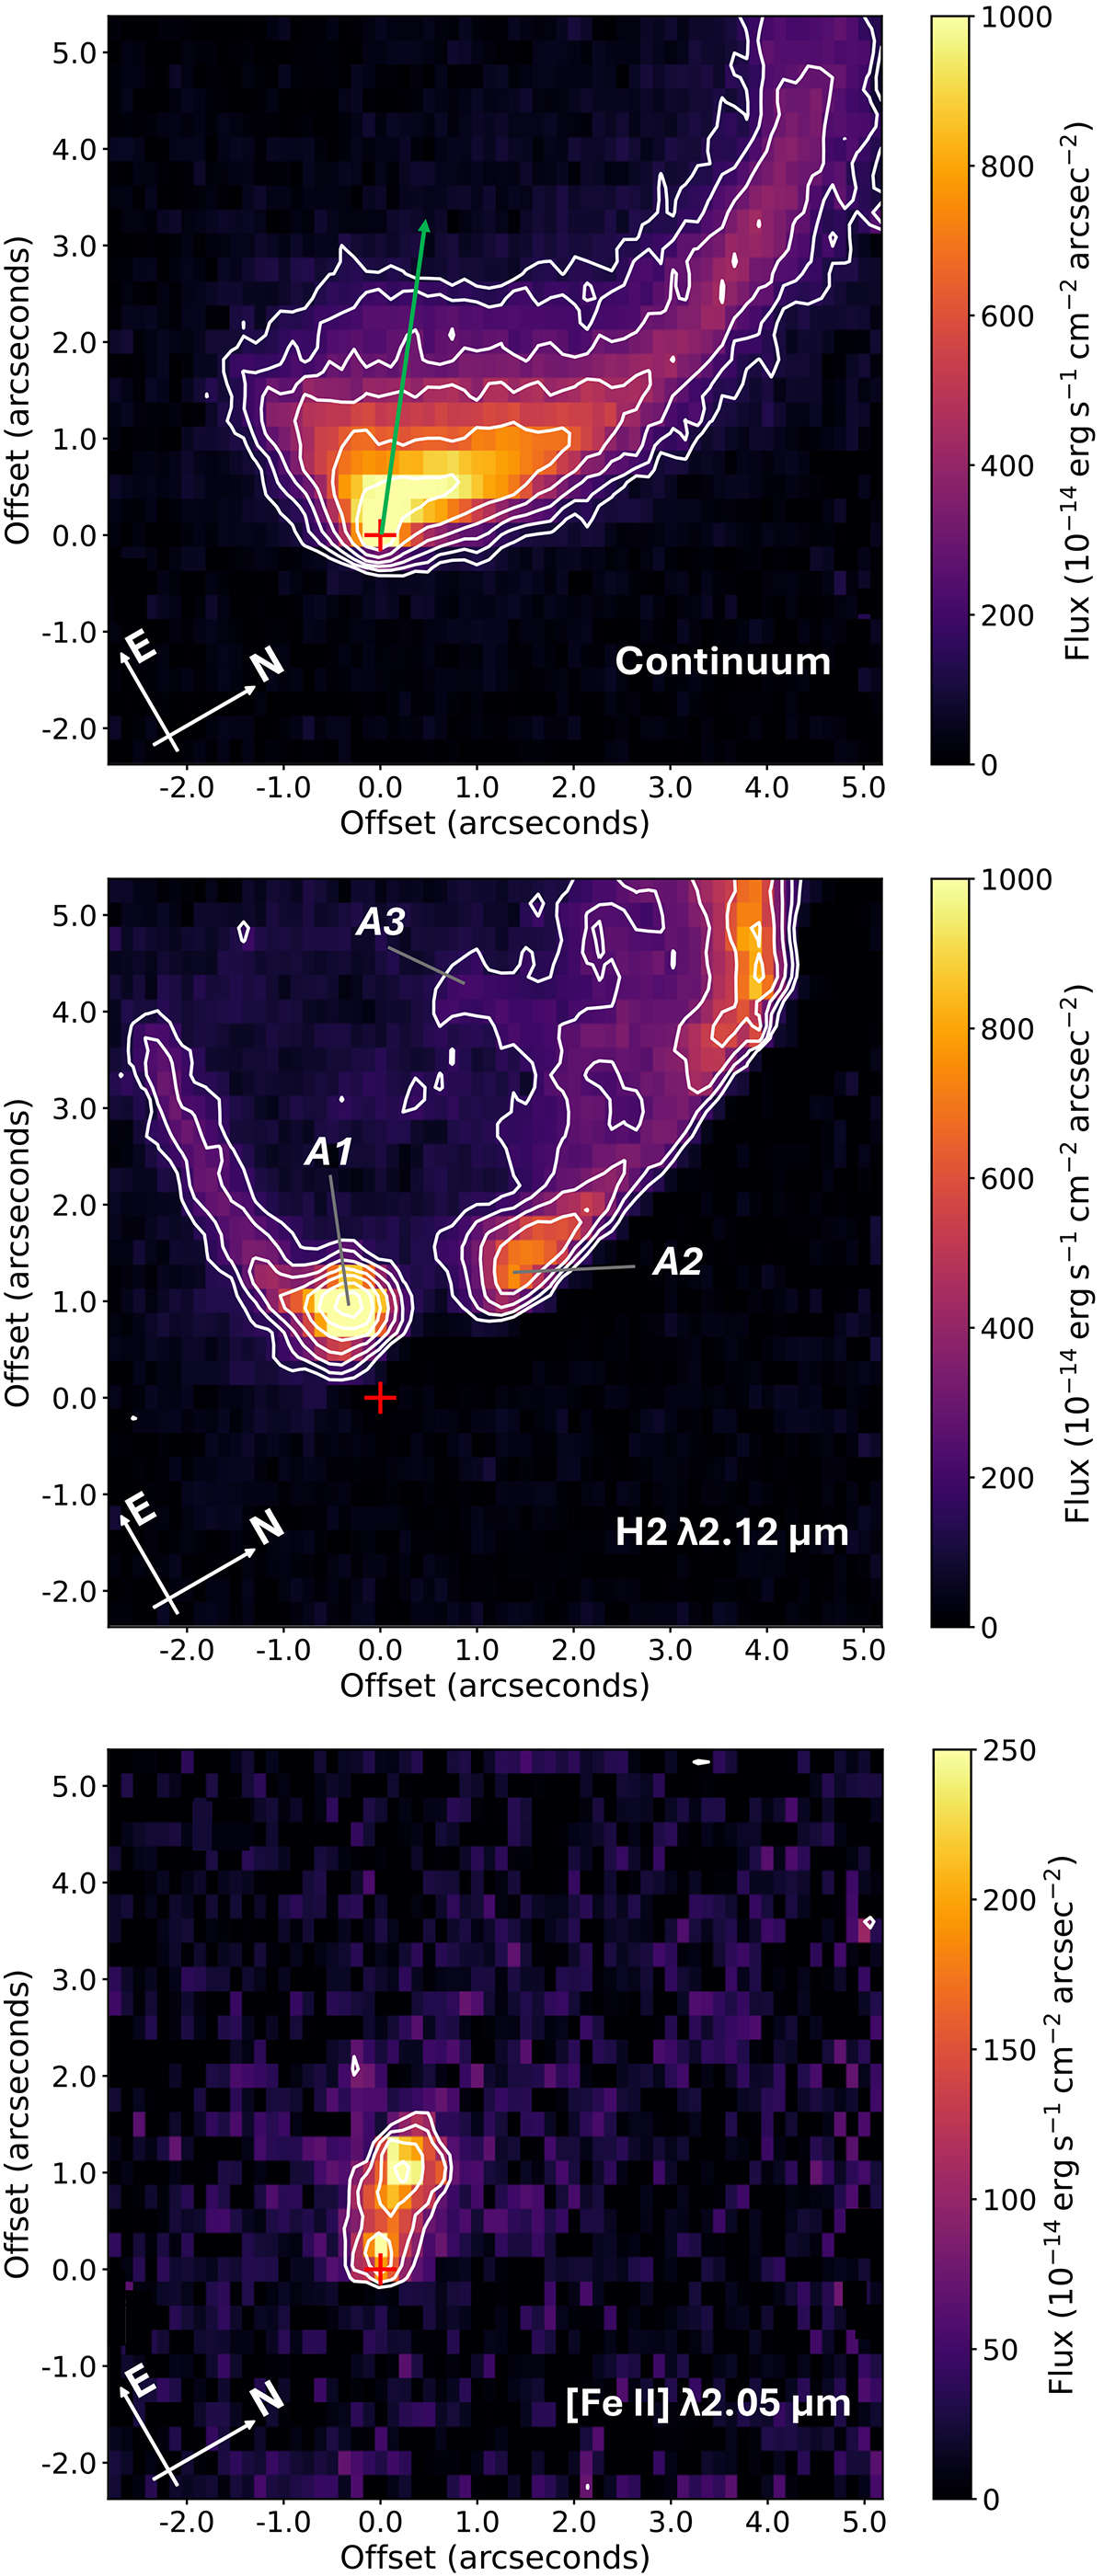
Fig. 1.
Download original image
Integrated intensity maps displaying the morphologies of the outflow in different emission tracers. The source position is marked with a red plus. Contour levels for all begin at 3σ of the background emission and increase by factors of 1.5. The vertical axis is aligned with centre axis of CO outflow (PA = 60°). Top: Continuum emission displaying a wide, approximately parabolic shape. Average jet PA of 52.3° indicated by a green arrow. Centre: Continuum subtracted and scattered light subtracted, integrated H2 emission displaying a V-shaped outflow cavity. Bottom: Continuum subtracted, integrated [Fe II] emission displaying collimated atomic jet emission.
Current usage metrics show cumulative count of Article Views (full-text article views including HTML views, PDF and ePub downloads, according to the available data) and Abstracts Views on Vision4Press platform.
Data correspond to usage on the plateform after 2015. The current usage metrics is available 48-96 hours after online publication and is updated daily on week days.
Initial download of the metrics may take a while.