Fig. 10
Download original image
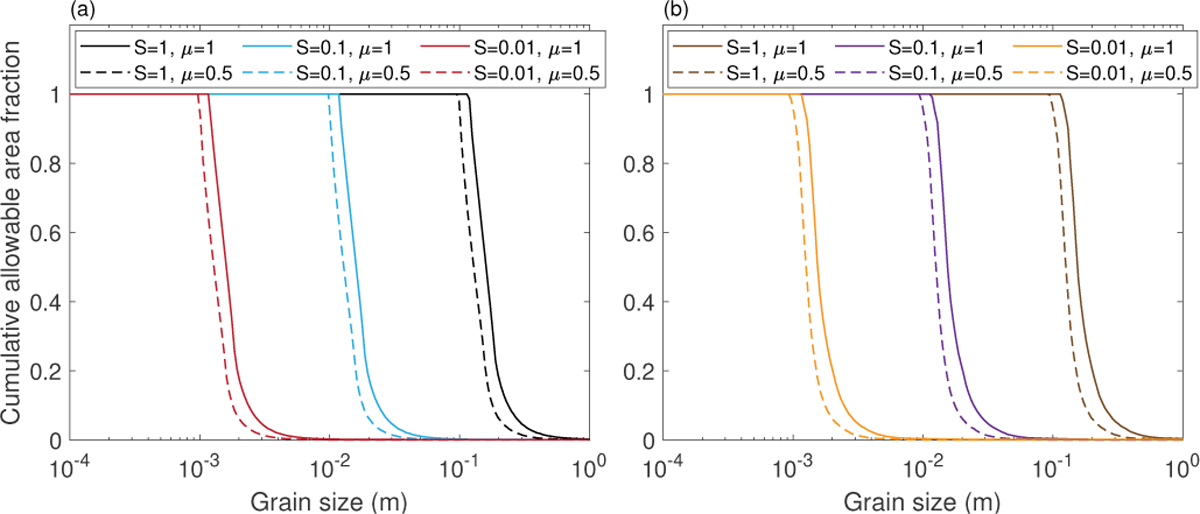
Cumulative area distribution for the maximum grain diameters to avoid both landslide and fission failures. Panel a shows the results for shape Model A, and panel b shows the results for shape Model B. For each model, distributions for different parameter combinations, cleanliness S ∊ {1, 0.1, 0.01), and coefficient of friction µ ∊ {1, 0.5) are calculated.
Current usage metrics show cumulative count of Article Views (full-text article views including HTML views, PDF and ePub downloads, according to the available data) and Abstracts Views on Vision4Press platform.
Data correspond to usage on the plateform after 2015. The current usage metrics is available 48-96 hours after online publication and is updated daily on week days.
Initial download of the metrics may take a while.