Fig. 9.
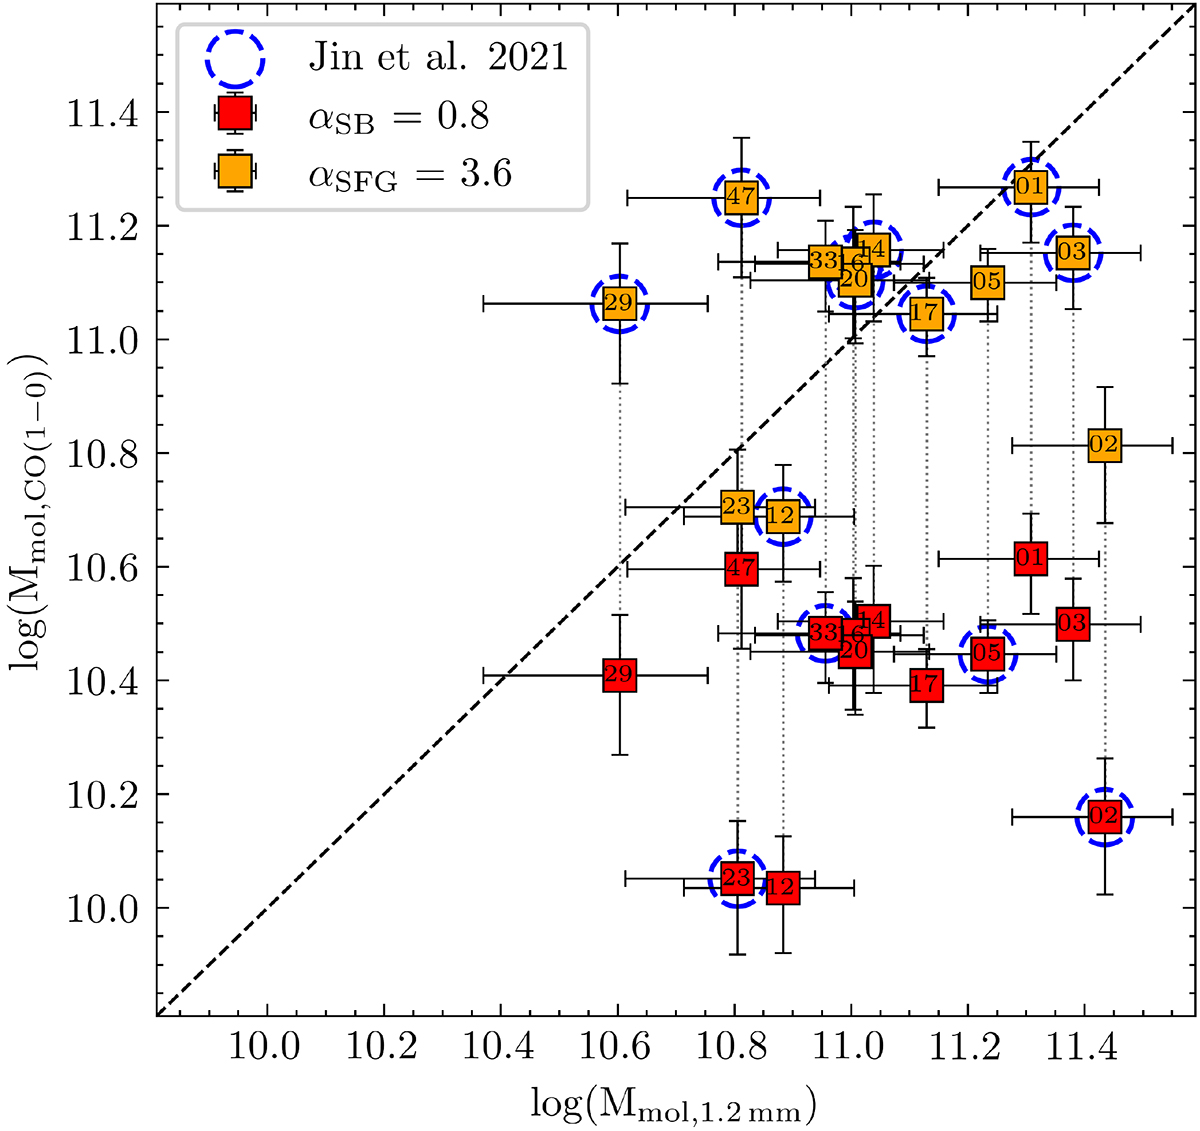
Download original image
Molecular gas content of the 13 ALMA sources with CO emitter counterparts, obtained from 1.2 mm fluxes and CO(1–0) luminosities, respectively. Different αCO values of 0.8 and 3.6 M⊙ (K km s−1 pc2)−1 are adopted to convert the CO luminosities to molecular gas masses and marked as red and orange, respectively. The gas measurements by using the αCO assigned for each source following Jin et al. (2021) are shown in blue dashed lines.
Current usage metrics show cumulative count of Article Views (full-text article views including HTML views, PDF and ePub downloads, according to the available data) and Abstracts Views on Vision4Press platform.
Data correspond to usage on the plateform after 2015. The current usage metrics is available 48-96 hours after online publication and is updated daily on week days.
Initial download of the metrics may take a while.