Fig. 7.
Download original image
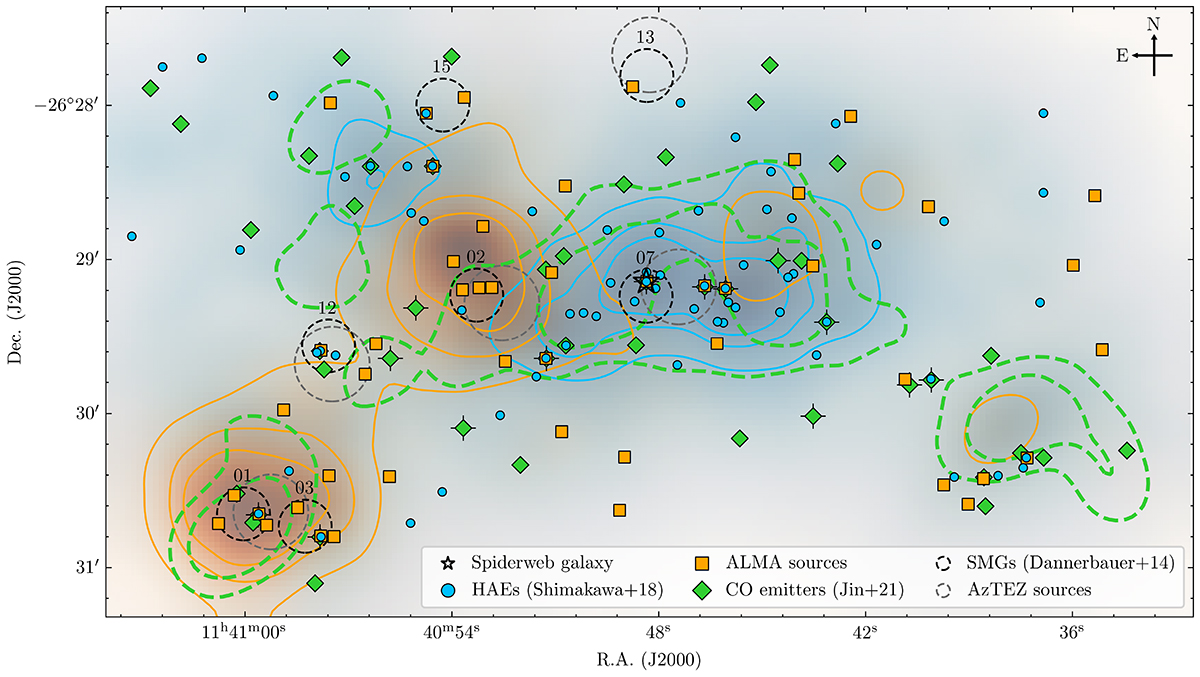
Spatial distribution of the ALMA sources detected in the ASW2DF survey. The blue circles mark the HAEs overlaid on the corresponding blue density map, which shows the excess of the surface number densities based on the fifth neighbor analysis (Shimakawa et al. 2018b). Our 47 ALMA sources from the main catalog are shown in orange squares, overlaid on the orange density map with same method as that of HAEs. We also show 46 CO emitters detected in the COALAS survey (Jin et al. 2021) as green diamonds; green dashed contours represent the corresponding density maps similar to those of ALMA sources and HAEs. Furthermore, 14 CO emitters identified as robust candidates for extended molecular gas reservoirs (Chen et al. 2024) are highlighted with black crosses. Seven LABOCA sources (Dannerbauer et al. 2014) and five AzTEC sources (Zeballos et al. 2018) within the ALMA field of view are shown as black dashed circles and gray dashed circles, which are sized according to the beam sizes of their respective single-dish telescopes.
Current usage metrics show cumulative count of Article Views (full-text article views including HTML views, PDF and ePub downloads, according to the available data) and Abstracts Views on Vision4Press platform.
Data correspond to usage on the plateform after 2015. The current usage metrics is available 48-96 hours after online publication and is updated daily on week days.
Initial download of the metrics may take a while.