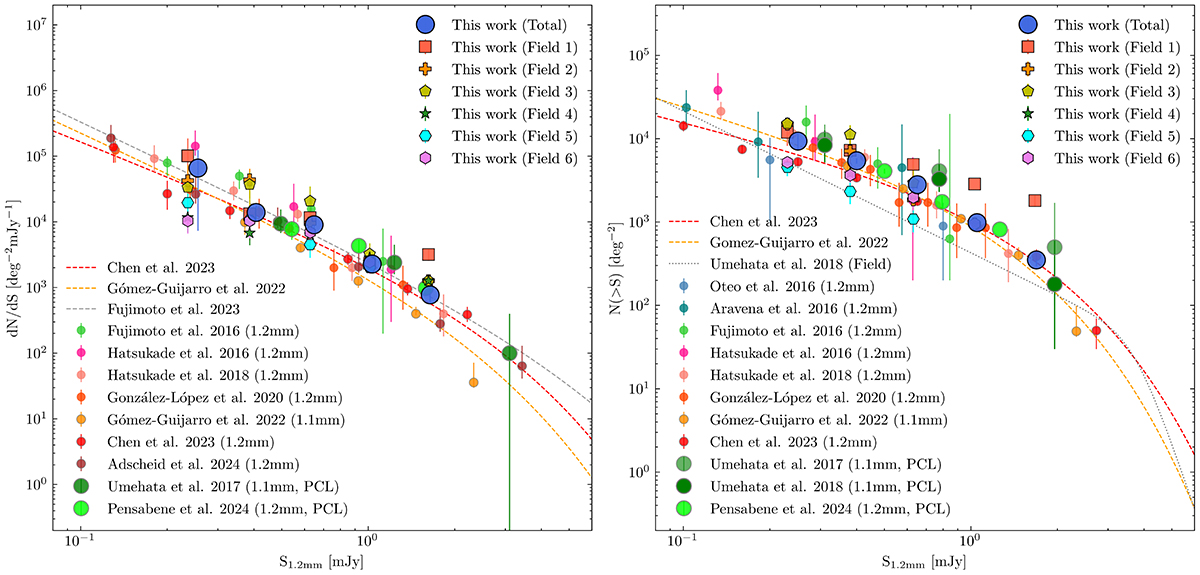
Fig. 6.
Download original image
Differential (left) and cumulative (right) number counts for the ASW2DF survey. The number counts are derived from the main science catalog, with the correction of completeness and purity for each source. Big blue circles show the total number counts from the six fields, and the results of each field are shown in various markers as shown in legend. The number counts from previous surveys at similar wavelengths are also shown with colored circles, where the larger circles represent the studies toward protocluster fields (PCL: Umehata et al. 2017, 2018; Pensabene et al. 2024). The gray, orange and red dashed lines show the best-fitting results in blank fields (Fujimoto et al. 2023; Gómez-Guijarro et al. 2022; Chen et al. 2023b) with a Schechter function. The gray dotted line in the right panel represents the best-fitting of cumulative number counts in general fields used in Umehata et al. (2018). The flux bins of the studies at 1.1 mm are converted to that at 1.2 mm according to the conversion factor of 1.29 (see Sec. 4.3).
Current usage metrics show cumulative count of Article Views (full-text article views including HTML views, PDF and ePub downloads, according to the available data) and Abstracts Views on Vision4Press platform.
Data correspond to usage on the plateform after 2015. The current usage metrics is available 48-96 hours after online publication and is updated daily on week days.
Initial download of the metrics may take a while.