Fig. 5.
Download original image
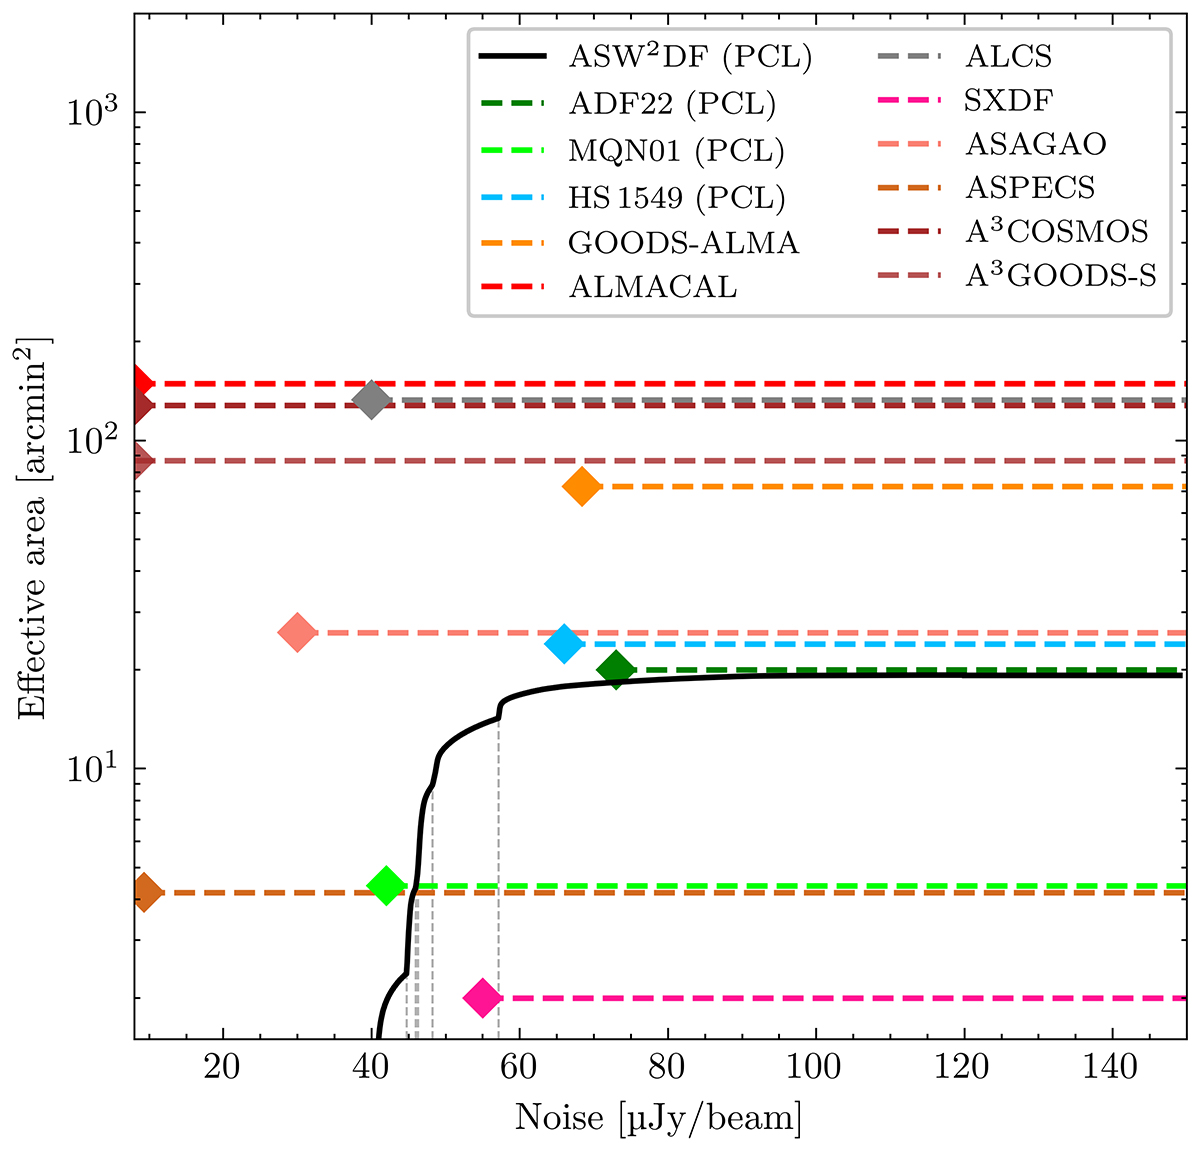
Effective area as a function of the local noise for our ASW2DF survey. The maximum area is 19.3 arcmin2 at a maximum noise of 120 μJy. The discontinuities in the black curve are due to the different 1σ sensitivities over the six fields, which are marked as vertical gray dashed lines representing Field 4, 6, 2, 1, 5, and 3 from left to right. The colored dashed lines show the survey area of other ALMA public surveys at similar wavelength, including SXDF (Hatsukade et al. 2016), ASAGAO (Hatsukade et al. 2018), ASPECS (Aravena et al. 2016; González-López et al. 2020); GOODS-ALMA (Gómez-Guijarro et al. 2022), ALMACAL (Oteo et al. 2016; Chen et al. 2023b), A3COSMOS and A3GOODS-S (Adscheid et al. 2024) for blank fields; ADF22 (Umehata et al. 2017, 2018), MQN01 (Pensabene et al. 2024) and HS 1549 (Wang et al. 2024) for protoclusters (PCL). The markers at the left side of the lines represent their typical 1σ noise. We put the markers from ALMACAL, A3COSMOS and A3GOODS-S to the far left of the figure, as they do not have a representative sensitivity due to the collection of different ALMA projects.
Current usage metrics show cumulative count of Article Views (full-text article views including HTML views, PDF and ePub downloads, according to the available data) and Abstracts Views on Vision4Press platform.
Data correspond to usage on the plateform after 2015. The current usage metrics is available 48-96 hours after online publication and is updated daily on week days.
Initial download of the metrics may take a while.