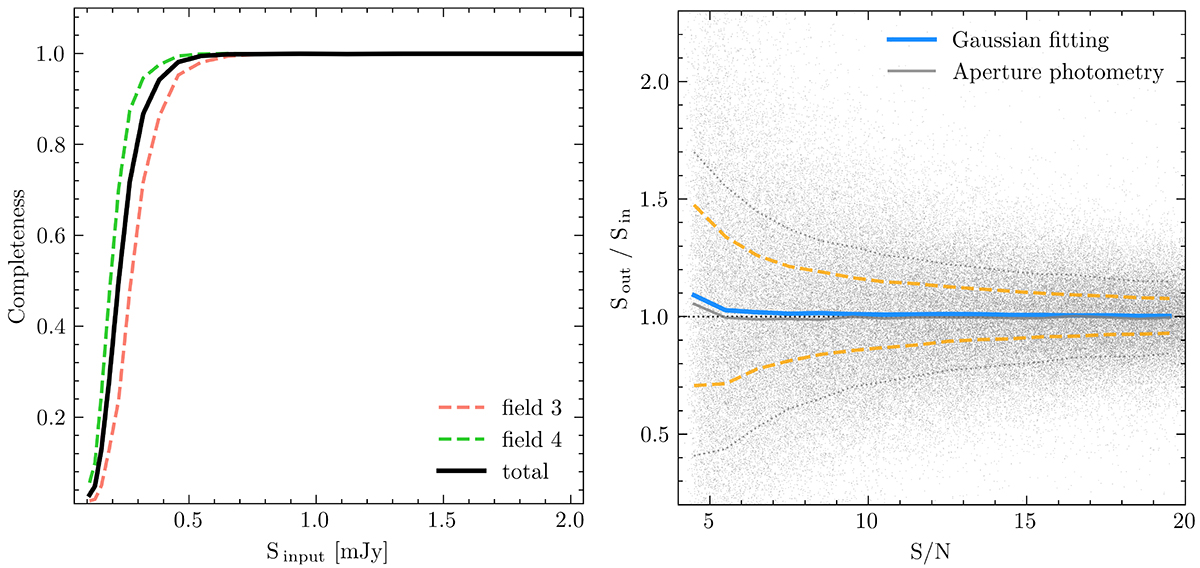
Fig. 4.
Download original image
Completeness and flux boosting obtained from the MC simulation. Left: completeness as a function of input fluxes for all six fields (black). The green and salmon lines show the completeness for Field 3 and 4, which are slightly different from the combined one and do not affect the results of the analysis. Right: flux boosting as a function of the peak S/N. The solid lines represent the median value of the boosting factor from the Gaussian fitting (blue) and aperture photometry (gray). The yellow dashed lines and gray dotted lines indicate uncertainties from the Gaussian fitting and aperture photometry, respectively.
Current usage metrics show cumulative count of Article Views (full-text article views including HTML views, PDF and ePub downloads, according to the available data) and Abstracts Views on Vision4Press platform.
Data correspond to usage on the plateform after 2015. The current usage metrics is available 48-96 hours after online publication and is updated daily on week days.
Initial download of the metrics may take a while.