Fig. 2.
Download original image
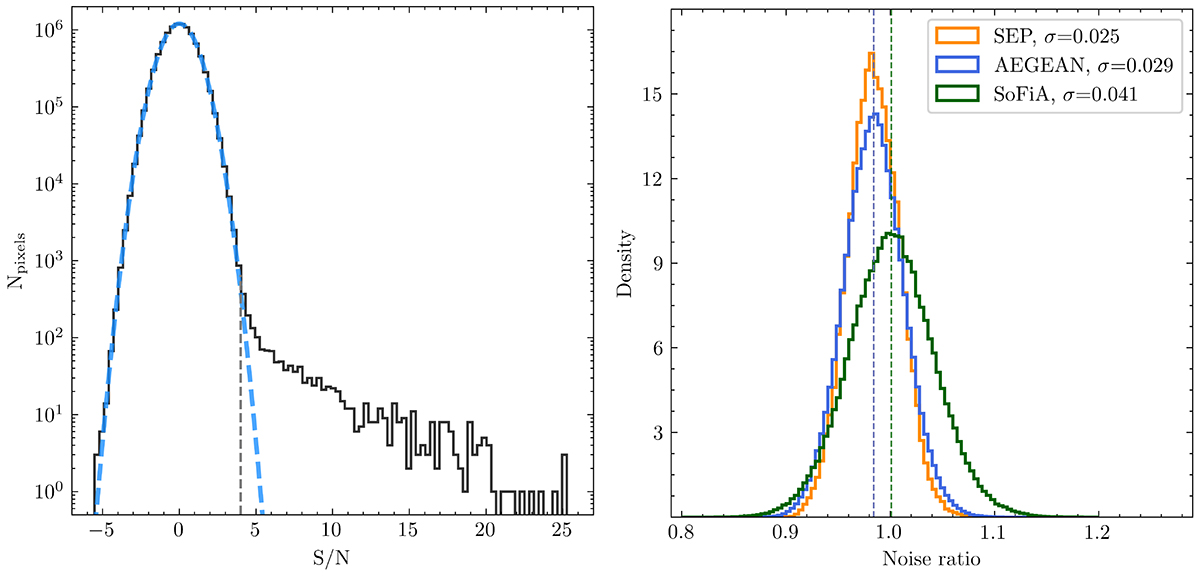
Pixel distribution of the S/N maps in all six fields (left) and distributions of the noise ratios between the noise estimated from the “individual” and “fixed” methods (right). The S/N map was obtained by dividing the science map and the typical 1σ noise in each field. The vertical dashed line in the left panel shows the adopted 4σ threshold during the source extraction. The noise ratio results from SEP, AEGEAN, and SOFIA are shown in yellow, blue, and green. The vertical dashed lines mark the median value from the corresponding ratio distributions. The median noise ratios of SEP and AEGEAN are very close and overlapped, around 0.984.
Current usage metrics show cumulative count of Article Views (full-text article views including HTML views, PDF and ePub downloads, according to the available data) and Abstracts Views on Vision4Press platform.
Data correspond to usage on the plateform after 2015. The current usage metrics is available 48-96 hours after online publication and is updated daily on week days.
Initial download of the metrics may take a while.