Fig. 10.
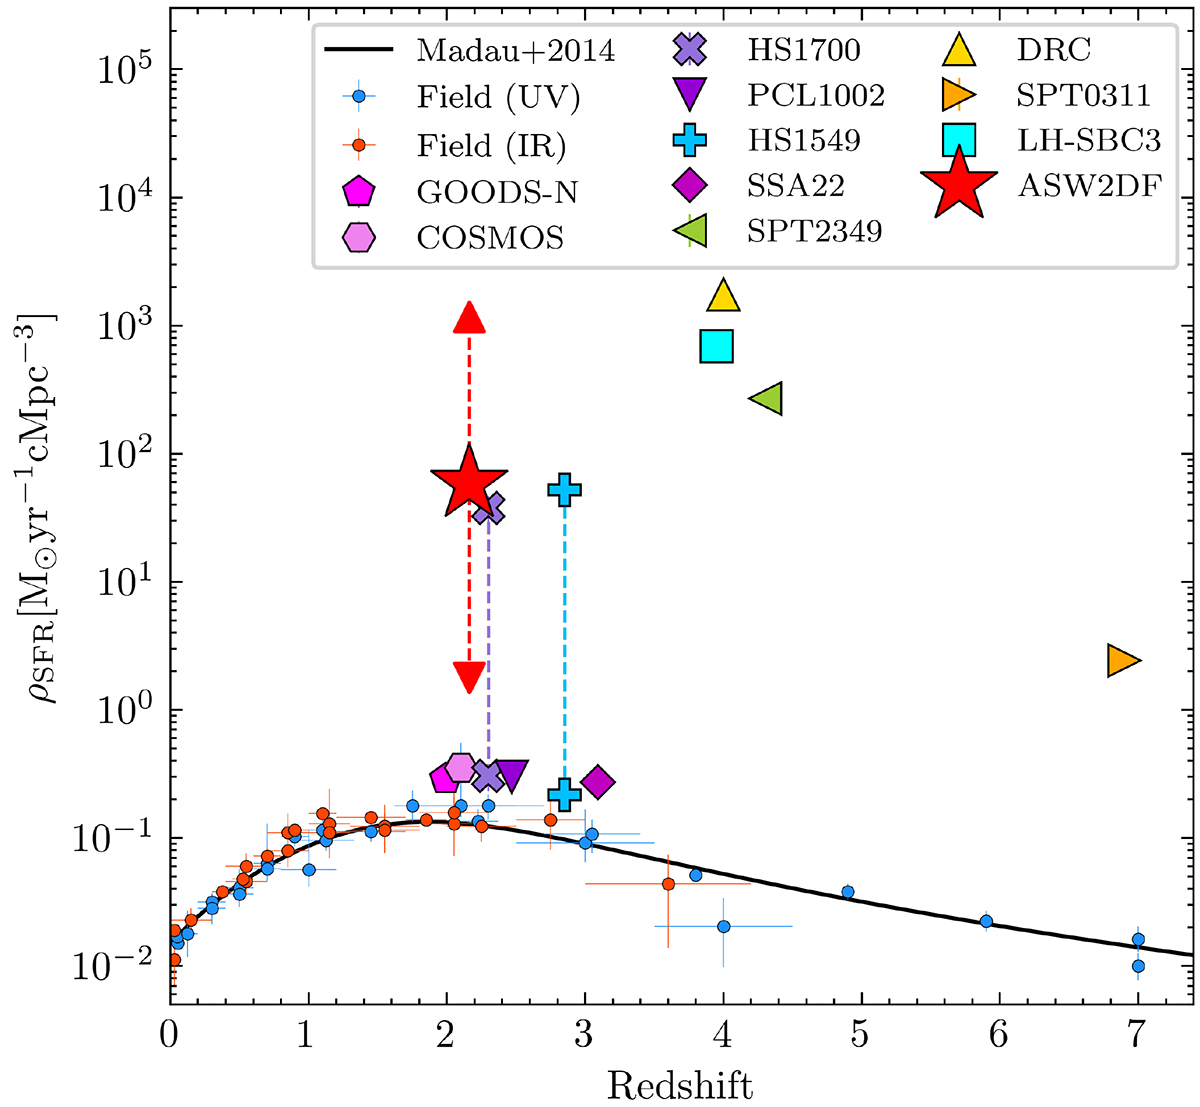
Download original image
Cosmic SFR density. The measurements for field galaxies and the best-fitting function are shown with dots (blue from UV and red for IR) and a black curve (Madau & Dickinson 2014). We also show the results of different protoclusters including GOODS-N protocluster, COSMOS protocluster and SSA22 (Casey 2016), PCL1002 (Champagne et al. 2021), HS1700+64 and HS1549+19 (Lacaille et al. 2019) with both overall and core estimations (linked by the dashed vertical lines with the same color), SPT2349−56 (Hill et al. 2020), Distant Red Core (DRC, Oteo et al. 2018), SPT0311−58 (Wang et al. 2021), and LH-SBC3 (Zhou et al. 2024b). The SFR density calculated in this work is shown as an red star, based on the volume of a 2 Mpc sphere (core-like) adopted in Dannerbauer et al. (2014). The volumes are also estimated based on group size (∼400 kpc) and the whole ALMA field of view (48 × 120 Mpc3), as shown in upward and downward arrows, respectively.
Current usage metrics show cumulative count of Article Views (full-text article views including HTML views, PDF and ePub downloads, according to the available data) and Abstracts Views on Vision4Press platform.
Data correspond to usage on the plateform after 2015. The current usage metrics is available 48-96 hours after online publication and is updated daily on week days.
Initial download of the metrics may take a while.