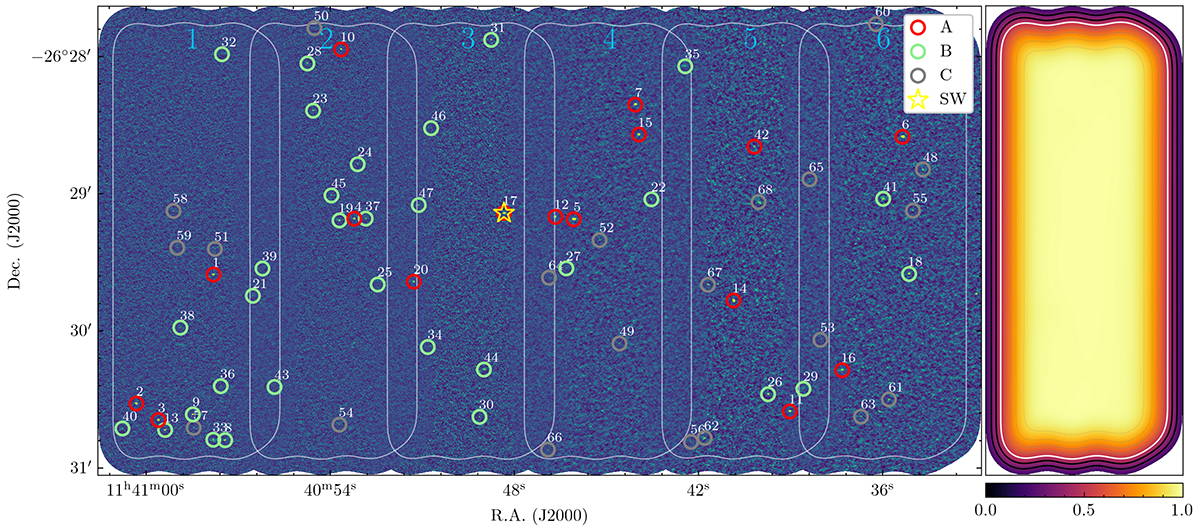
Fig. 1.
Download original image
ALMA 1.2 mm continuum map of the ASW2DF survey (left) and primary beam response of Field 1 (right). The fields from left to right are coded by the numbers one through six. Our ALMA detections are classified into three categories and marked as red, green, and gray circles and where A indicates the “best” sources identified by all codes and visual inspection, B is the remaining ones in the main catalog, and C is for the sources in the supplementary catalog (see Sec. 3.2). The IDs of the ALMA detections in the main and supplementary catalog are marked as white numbers, as listed in Tables 2 and 3. The white curves enclose the coverage where the primary beam response larger than 0.5 in each field. The images before the primary beam correction are used for clarity. We note that the primary beam response in each field is identical but characterized by various 1σ noise. The contours from inner to outer regions are the primary beam correction starting from 0.9 decreasing in a step of 0.1. The white contour surrounds the coverage where PB > 0.5, which will be used for our following analysis.
Current usage metrics show cumulative count of Article Views (full-text article views including HTML views, PDF and ePub downloads, according to the available data) and Abstracts Views on Vision4Press platform.
Data correspond to usage on the plateform after 2015. The current usage metrics is available 48-96 hours after online publication and is updated daily on week days.
Initial download of the metrics may take a while.