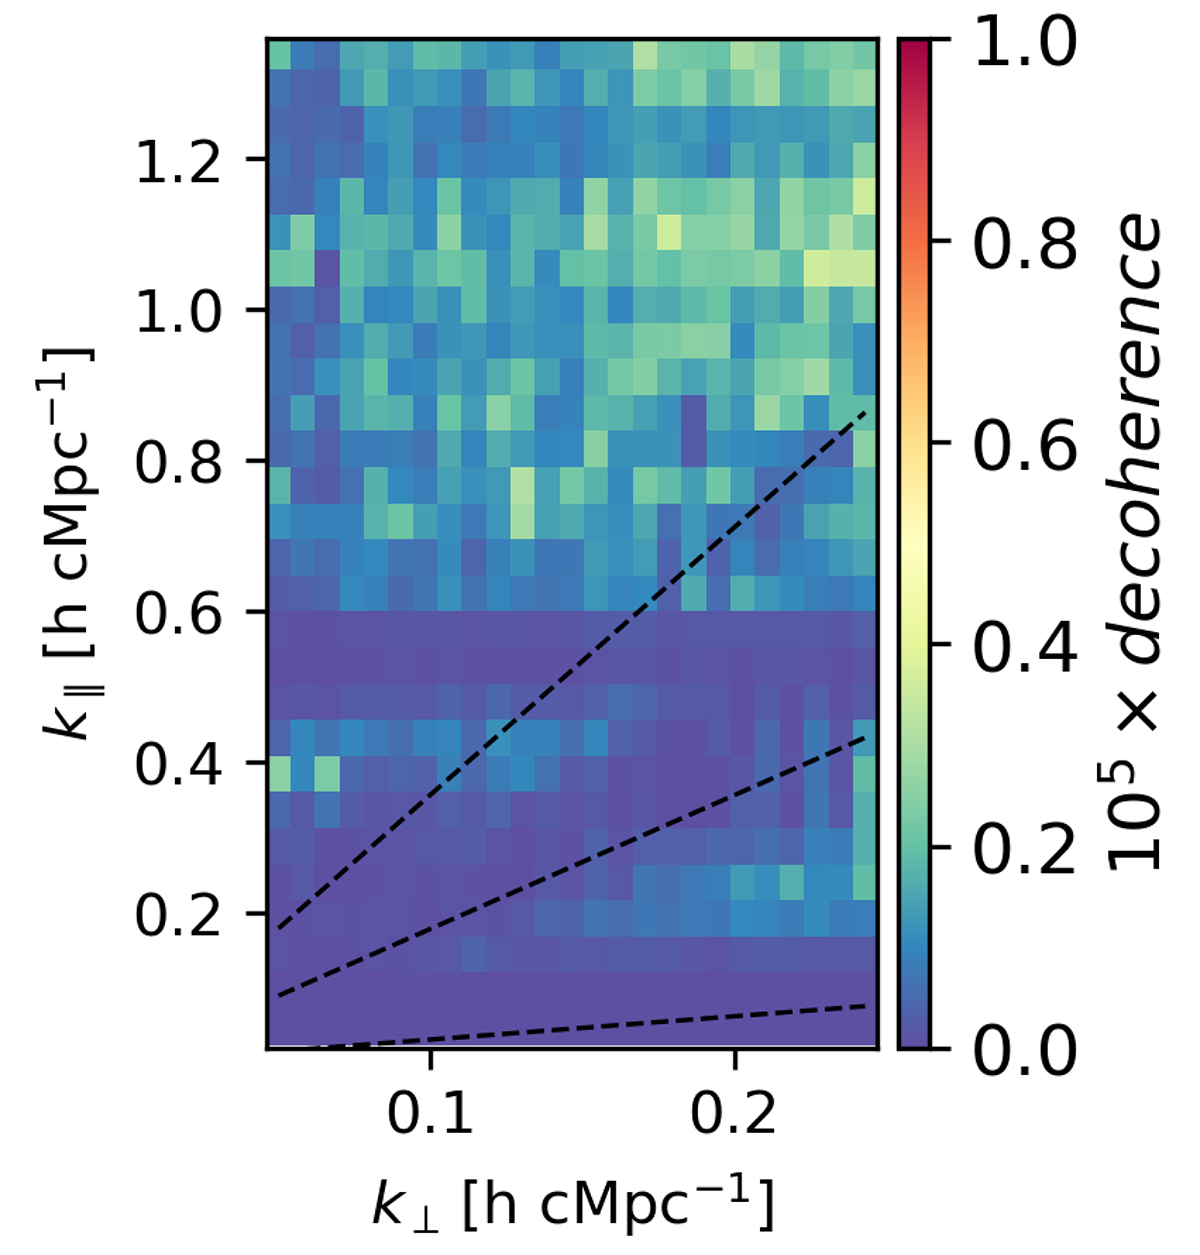
Fig. 7.
Download original image
Amount of signal de-correlation (due to a reduced S/N) resulting from calibration of a compressed dataset instead of its original version (without compression). The same calibration gains solutions set is applied to both the reference and compressed data before computing the coherence. The dashed lines show the 5, 30 and 90° delay lines.
Current usage metrics show cumulative count of Article Views (full-text article views including HTML views, PDF and ePub downloads, according to the available data) and Abstracts Views on Vision4Press platform.
Data correspond to usage on the plateform after 2015. The current usage metrics is available 48-96 hours after online publication and is updated daily on week days.
Initial download of the metrics may take a while.