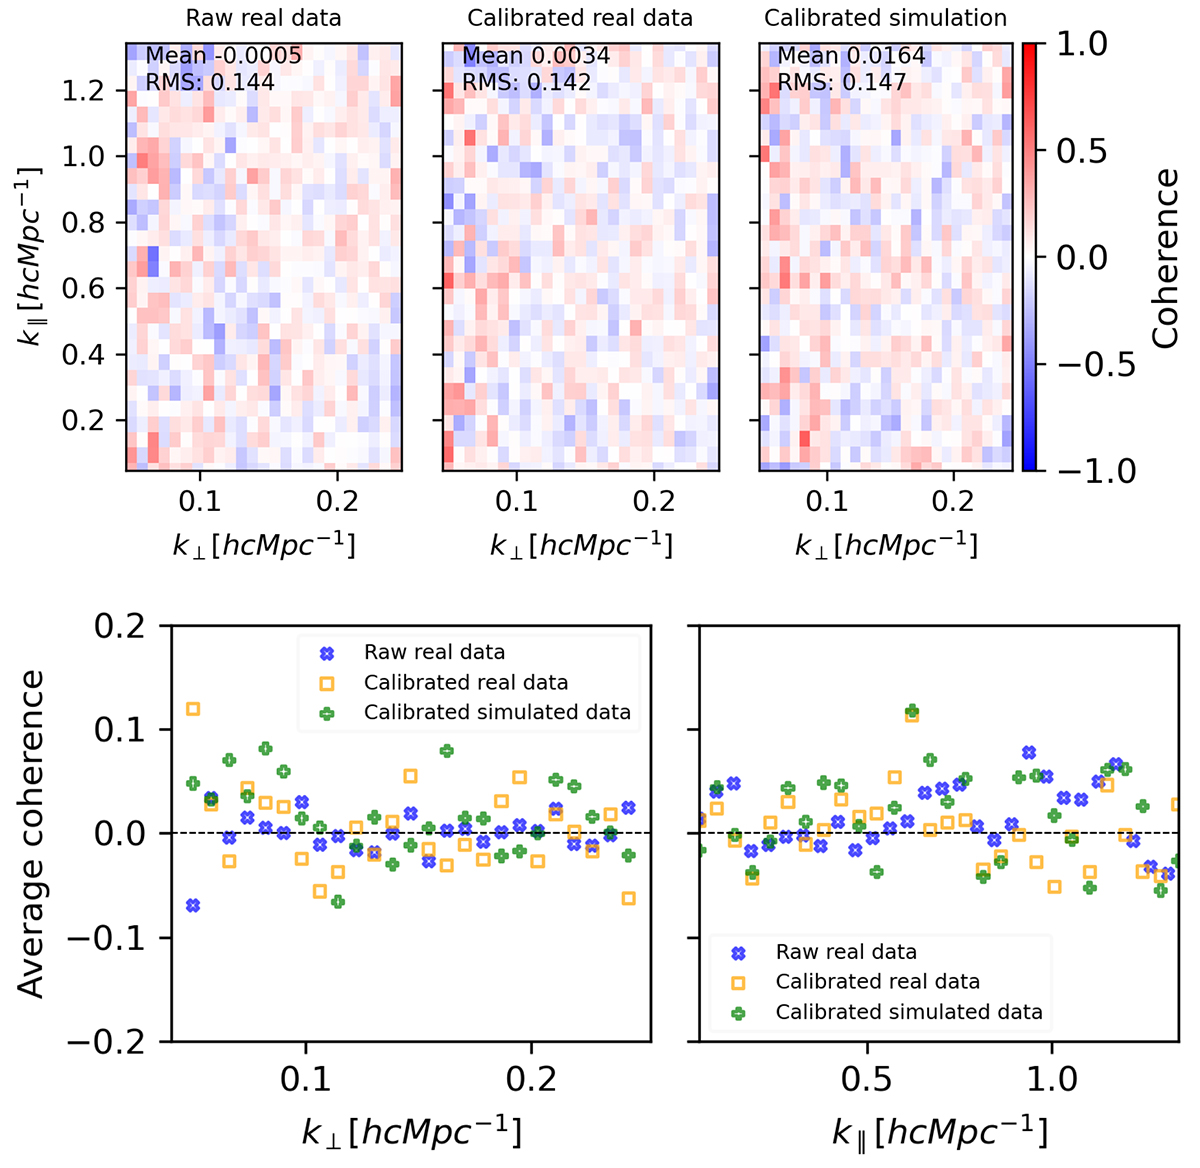
Fig. 4.
Download original image
Compression residuals coherence for raw real, calibrated real, and calibrated simulated data. For each panel in the top row, the coherence is computed using two compressed minus uncompressed data residuals from two separate datasets. To eliminate solver noise, the calibration gains solution from each uncompressed dataset is applied to its compressed version before obtaining the residuals. The average coherence for each top row panel is shown in the bottom row as a function of both k⊥ (left) and k∥ (right) modes.
Current usage metrics show cumulative count of Article Views (full-text article views including HTML views, PDF and ePub downloads, according to the available data) and Abstracts Views on Vision4Press platform.
Data correspond to usage on the plateform after 2015. The current usage metrics is available 48-96 hours after online publication and is updated daily on week days.
Initial download of the metrics may take a while.