Fig. 3.
Download original image
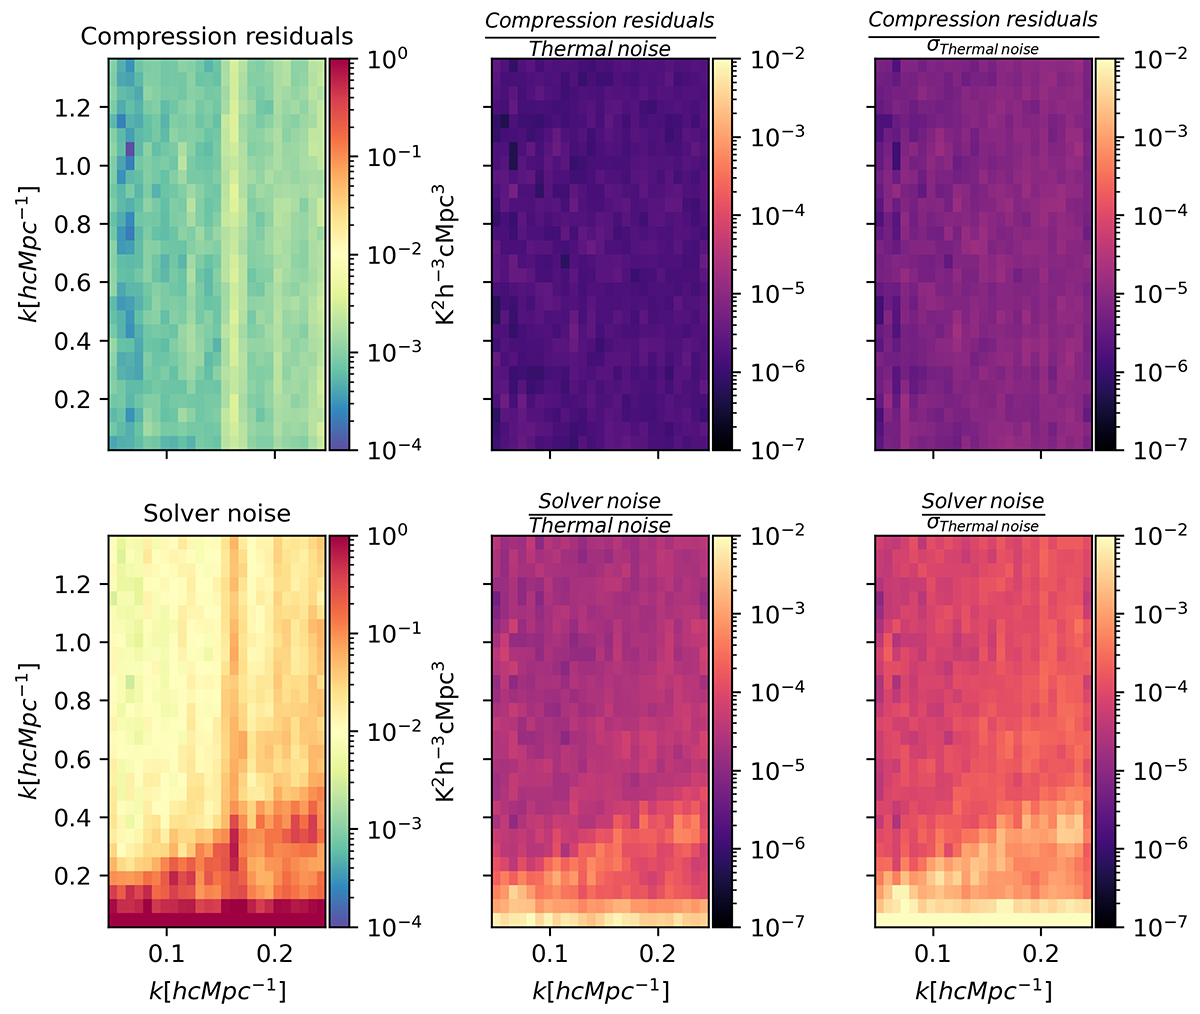
Comparisons between the cylindrically averaged power spectra of both compression and solver noise to the thermal noise and the thermal noise uncertainty after calibration. The top row shows the cylindrically averaged power spectrum of the compression noise (top left), its ratio with the thermal noise power spectrum (top middle), and the thermal noise uncertainty (top right). Similarly, the bottom row shows the solver noise power spectrum (bottom left) and its ratio with both the thermal noise power spectrum (bottom middle) and the thermal noise uncertainty (bottom right). The thermal noise and compression residuals here are obtained from real calibrated data.
Current usage metrics show cumulative count of Article Views (full-text article views including HTML views, PDF and ePub downloads, according to the available data) and Abstracts Views on Vision4Press platform.
Data correspond to usage on the plateform after 2015. The current usage metrics is available 48-96 hours after online publication and is updated daily on week days.
Initial download of the metrics may take a while.