Open Access
Fig. 4.
Download original image
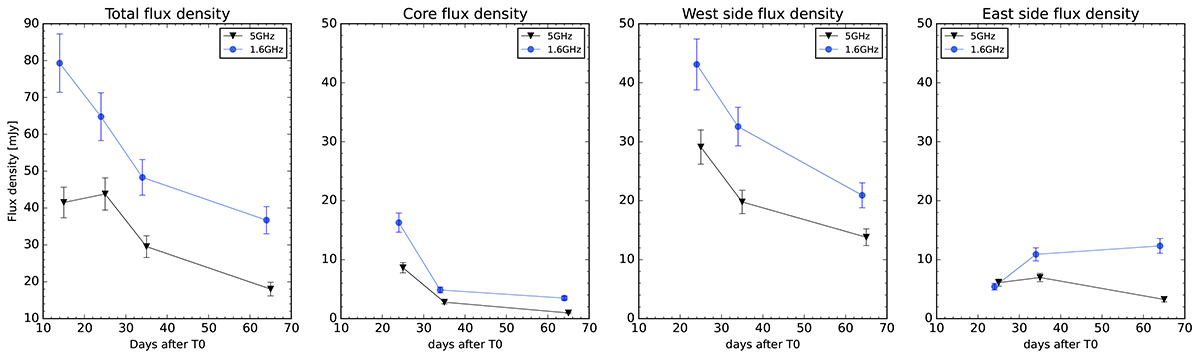
Light curves at 1.6 GHz (blue circles) and 5 GHz (black triangles) for the whole source (first frame), the core (second frame), the western lobe (third frame), and the eastern lobe (fourth frame). All values are reported in Table 3.
Current usage metrics show cumulative count of Article Views (full-text article views including HTML views, PDF and ePub downloads, according to the available data) and Abstracts Views on Vision4Press platform.
Data correspond to usage on the plateform after 2015. The current usage metrics is available 48-96 hours after online publication and is updated daily on week days.
Initial download of the metrics may take a while.