Open Access
Fig. 3.
Download original image
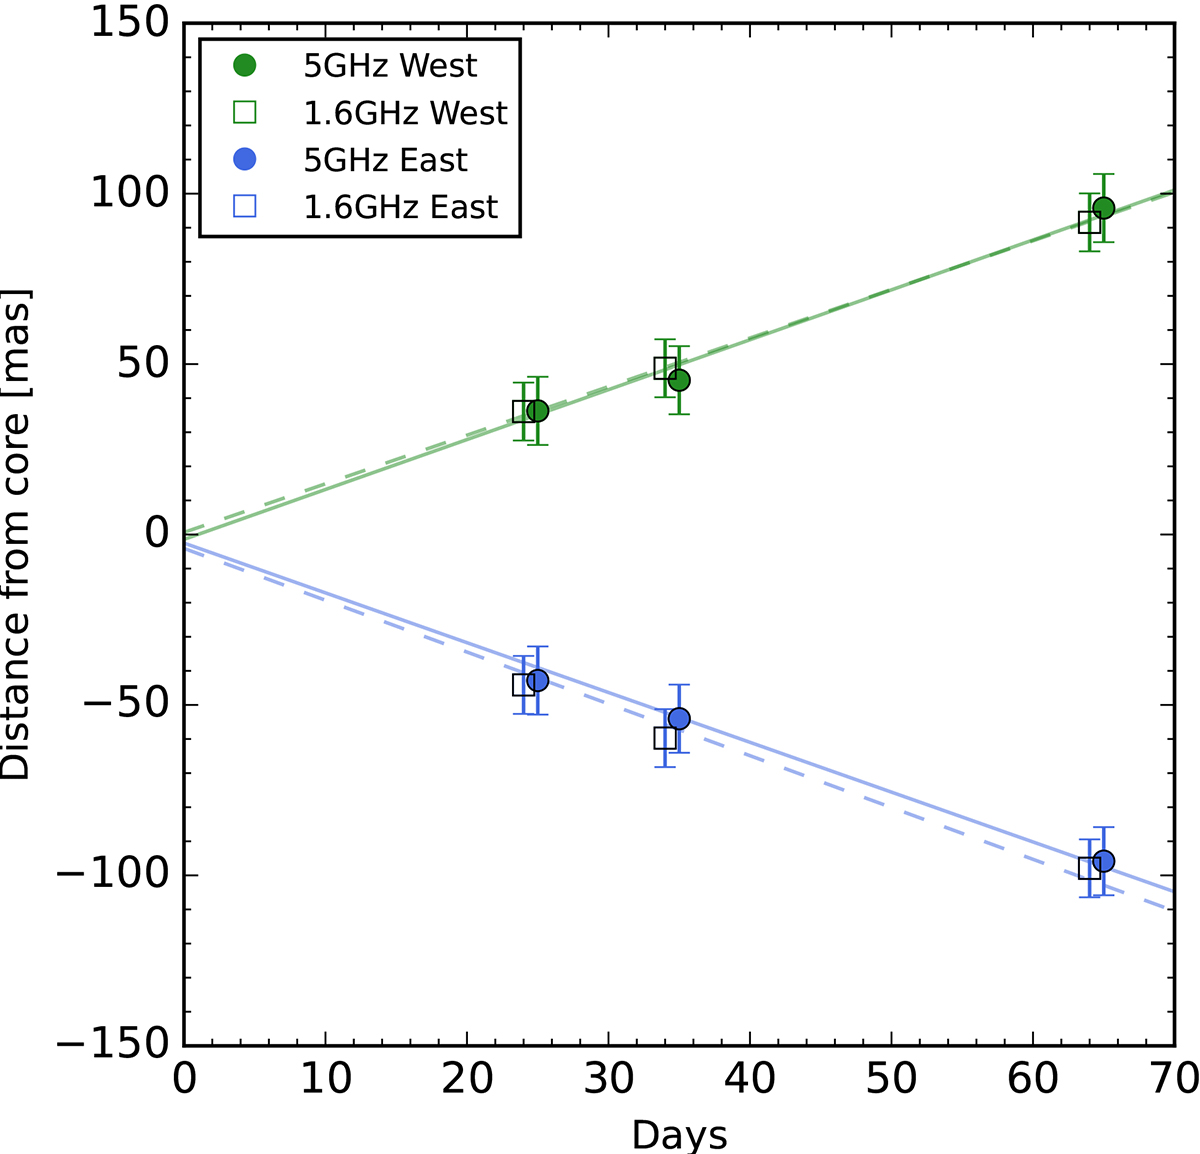
Angular separation evolution with time of the eastern (blue) and the western (green) lobes at 1.6 GHz (empty squares) and 5 GHz (filled circles). The solid and dashed lines represent the best least-square regression fit for the 5 and 1.6 GHz data, respectively.
Current usage metrics show cumulative count of Article Views (full-text article views including HTML views, PDF and ePub downloads, according to the available data) and Abstracts Views on Vision4Press platform.
Data correspond to usage on the plateform after 2015. The current usage metrics is available 48-96 hours after online publication and is updated daily on week days.
Initial download of the metrics may take a while.