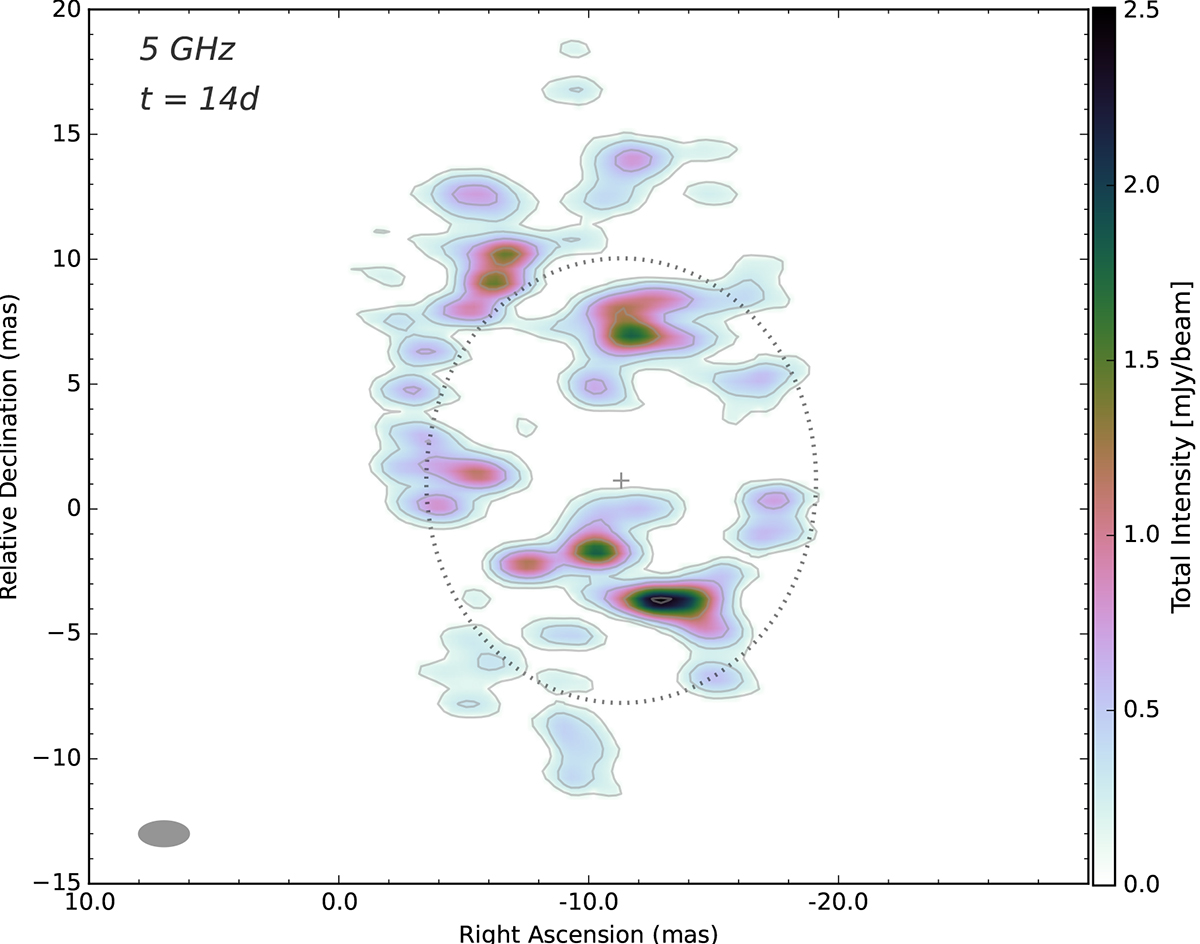
Fig. 2.
Download original image
Full-resolution 5 GHz total intensity image during epoch I (14 days after T0) with relative coordinates referring to the Gaia DR3 astrometric position of RS Oph, corrected for proper motion. The convolving beam, displayed in the bottom-left corner of the image, is 1.0 mas × 2.0 mas at 90°. The color scale and the overlaid contours represent the total intensity emission, with the lowest contour at 5% of the map peak (see Table 1) and the following contours a factor of two higher. The gray dots represent the best-fitting ellipse obtained by O’Brien et al. (2008) at the same frequency and epoch after the 2006 outburst.
Current usage metrics show cumulative count of Article Views (full-text article views including HTML views, PDF and ePub downloads, according to the available data) and Abstracts Views on Vision4Press platform.
Data correspond to usage on the plateform after 2015. The current usage metrics is available 48-96 hours after online publication and is updated daily on week days.
Initial download of the metrics may take a while.