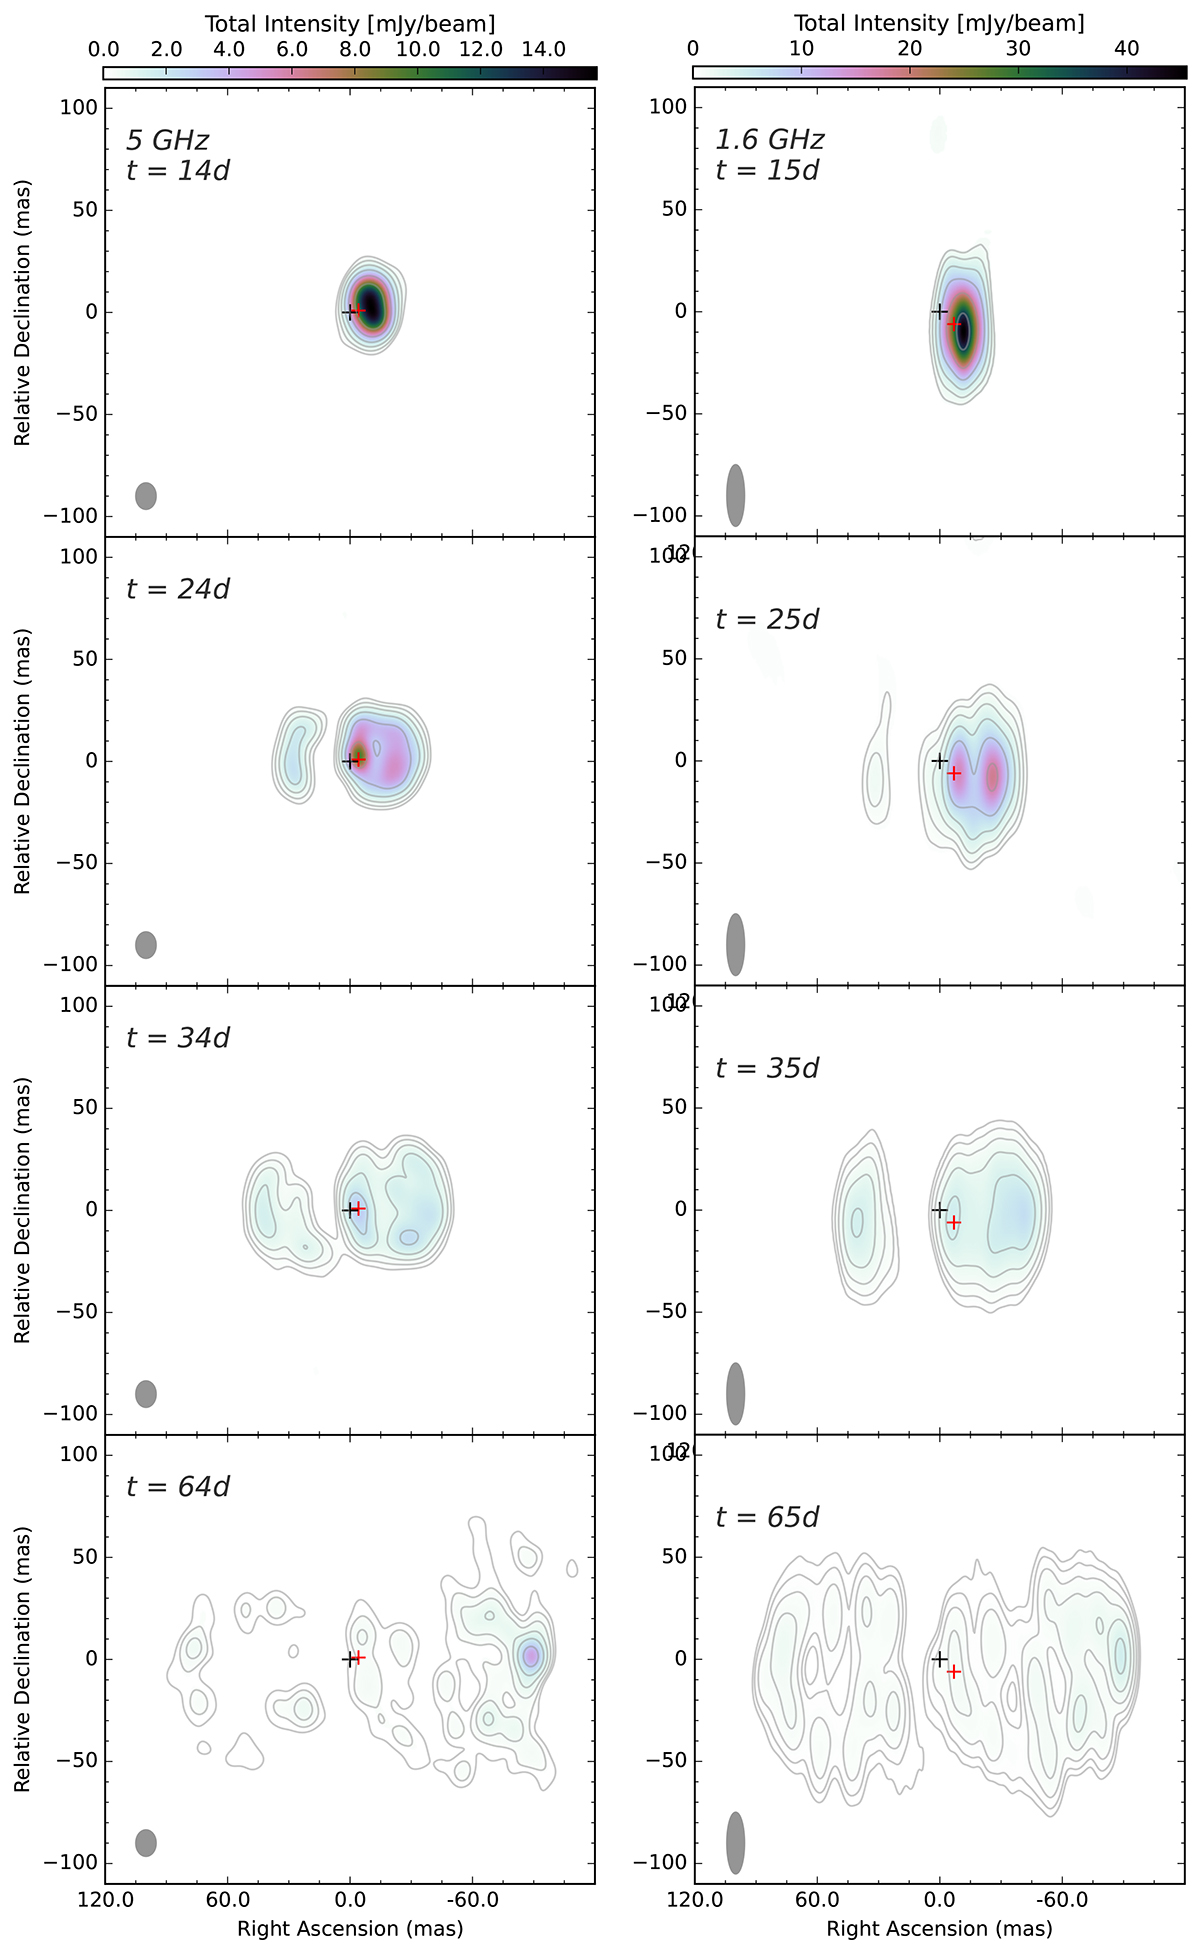
Fig. 1.
Download original image
Natural-weighted total intensity images at 5 GHz (left frame) and 1.6 GHz (right frame), centered at the Gaia DR3 astrometric position for RS Oph (RA 17h50m13.1610s, Dec −06d42′28.61026′′), corrected for proper motion (indicated by a black cross whose size represents the position uncertainty magnified by a factor of 40 for visualization). The observing epoch, in units of days after T0, is indicated in the top-left corner of each image. All 5 GHz images (left panel) are displayed with a Gaussian taper of 0.5 at 10 Mλ and convolved with a beam of 9.8 mas × 12.8 mas at 0°. All 1.6 GHz images (right panel) are convolved with a beam of 8.5 mas × 30.0 mas at 0°. This restoring beam is displayed in the bottom-left corner of each image. The color scale and the overlaid contours represent the total intensity emission, with the lowest contour at 2% of the map peak (see Table 1) and the following contours a factor of two higher. The red cross indicates the average core position (see Sect. 3.3).
Current usage metrics show cumulative count of Article Views (full-text article views including HTML views, PDF and ePub downloads, according to the available data) and Abstracts Views on Vision4Press platform.
Data correspond to usage on the plateform after 2015. The current usage metrics is available 48-96 hours after online publication and is updated daily on week days.
Initial download of the metrics may take a while.